
Nike, Inc. A great company. Great products. A bad performing stock. In this post, I will share with you my stock analysis of Nike (ticker NKE). I will also express my view if it’s a buy or sell for me. So, let`s just do it.
I am pretty sure that all of us are aware of what Nike does. Despite that, let`s honor the tradition and have a brief introduction:
Nike, Inc. (ticker NKE) is a leading global designer, marketer, and distributor of athletic footwear, apparel, equipment, and accessories. Headquartered in Beaverton, Oregon, Nike operates in over 190 countries and maintains a strong presence in retail and e-commerce. The company is known for its innovation, quality products, and powerful brand identity. This makes it a key player in the athletic wear market.
Nike’s business model is centered around the creation of cutting-edge products that cater to the needs of athletes and fitness enthusiasts. The brand invests heavily in research and development to ensure that its offerings incorporate the latest technologies and materials. Additionally, Nike employs a multi-channel distribution strategy, leveraging both direct-to-consumer sales through its website and retail stores, as well as partnerships with third-party retailers. This allows Nike to reach a broad audience while enhancing brand loyalty through direct engagement with customers. Overall, Nike’s focus on innovation and consumer experience has established it as a dominant force in the athletic industry.
Now that we know what Nike is doing as company, let`s check the stock performance. I believe that the stock price chart is a good place to start:

My affiliate link. Sign up by using it and enjoy 15 USD bonus. Full details below.
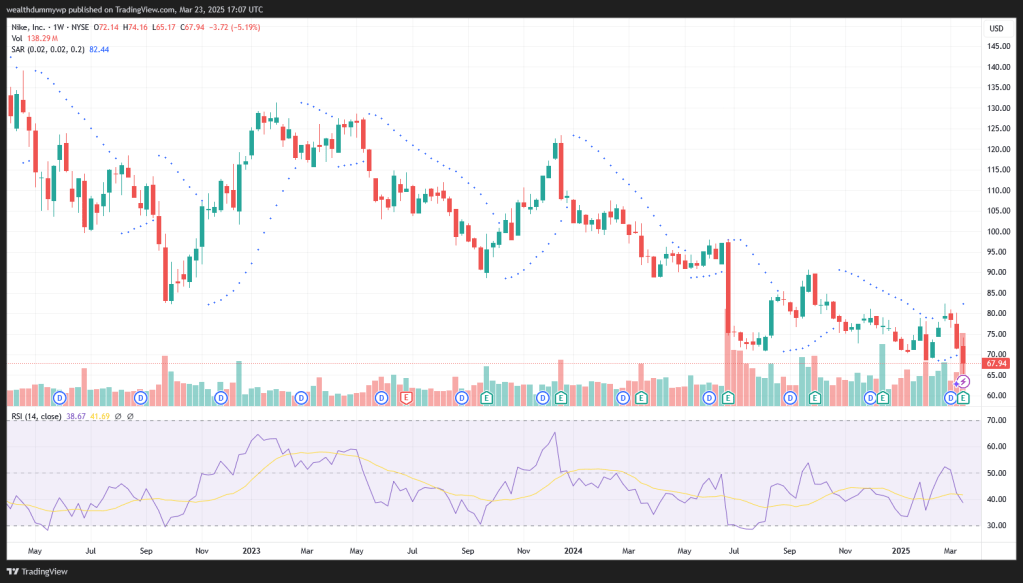
Looking at the price chart we can see that the stock is experiencing a significant selling pressure. It is far from its 52-week highs of $98.04, but it`s near to the 52-week low of $65.17. In my opinion the reason for this performance is the weak consumer demand. The possibility for increased tariffs also doesn`t help. In addition to that, Nike is offering discounts on their classics, so they can reduce the inventories. Analysts are worried that such discounts, might damage the brand. As we can see there are a lot of headwinds that are baked into the Nike`s stock price. Having in mind all of that, it`s not surprising that the shares are trading at levels last seen in March 2020.
If you enjoy reading the post so far, please consider subscribing to my blog:
On the price chart above we can see that in January 2023 the stock was trading around $128. Back then, I thought that it is highly overvalued and I was expecting it to go lower. The recent 52-week high was at $98.04. I believed that the stock is still overvalued at this level. Now at the current price (at the time of writing) of $67.94, I think that we are getting closer to the fair value. Let`s check some of the fundamental ratios, so we can see what I mean:
P/E Ratio: 23.91
P/S Ratio: 2.22
P/B Ratio: 7.59
From the ratios above we can see that the stock doesn`t exactly scream cheap from a value perspective. Yes, it is definitely cheap if compared to previously seen ratio levels of Nike. In the last 5 years the company was always trading at P/E, P/S and P/B ratios higher than the current ones. If this is the base for the comparison the shares look cheap. As an investor I don`t pay much attention to the historic values. Maybe it`s wrong to ignore them. But I am mainly interested in what I am getting for the price I am paying.
Now, let`s check some profitability ratios. The current Gross margin is about 41.49%. The 5 year average for the Gross Margin is around 43.94%. The current Net Profit Margin is 7.05%. The 5 year average is about 10.71%. We can see that the margins are below the 5 year average. This, combined with the expectations for a lower revenue this year, means that the Net Income will be at a lower at level. The current Return on equity (ROE) is 31.93. The 5 year average for this metric is about 40.50. Current Return on Assets (ROA): 12. The 5 year average is about 13.87. We can see that ROE and ROA are also below the 5 year average. The lower levels of the profitability ratios indicate that there are some headwinds in the company`s operations. I believe that it is safe to conclude that the profitability performance isn`t something stellar.
The future earnings. I am always checking the analysts expectations. This isn`t a key indicator for me, since nobody can predict the future with a 100% accuracy. Still, it`s a good starting point. So, let`s check what are the expectations.
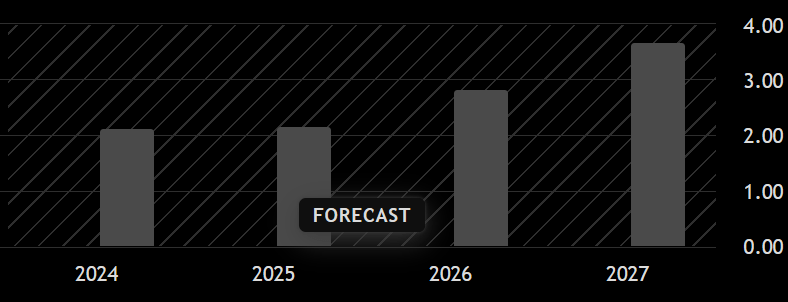
From the graph we can see that the analysts are expecting the following earnings per share (EPS):
2024: $2.12
2025: $2.16
2026: $2.82
2027: $3.67
If the analysts are correct in 2024 and 2025 there won`t be much improvement. The expected EPS is down from 2023. Back then the reported EPS was $3.95. Some improvement is expected in 2026 and in 2027. Even then, the forecasted EPS will be below the one in 2023. Of course, these are just forecasts, but they add some value to my analysis. Let`s assume that the analysts are accurate in their forecasts and Nike will deliver an EPS of $3.67 in 2027. Also, let`s imagine that the stock will be trading at the current P/E ratio of 23.91. This means that in 2027 the stock price needs to be around $87.75. We can see that this price level is above the current of $67.94. So, yes, it is supposed to be a profitable investment. But the return that will be generated based on these assumptions is not good enough for me. I would like to see some more upside potential, in order to be compensated for the risk.
Recently, I read an article addressing Nike`s latest earnings report and the headwinds that the company is facing. If you are interested in reading it, I am leaving a link to The Motley Fool.
My next steps. Currently, I am planning to be on the sidelines. Also, in order to be completely transparent, at the time of writing I don`t own any shares of Nike. I still like the brand and the business. However, I will need a better valuation, so I can justify the risk. Of course, I have a magic number in my head. If the stock price gets near or below $55, this will give me the risk/reward profile that I want. If this happens, I intend to start building a position. I will just do it.
If you enjoy reading my posts and find them useful, please consider subscribing to my blog. This way you`ll be notified as soon as I post something new. If you believe that someone may be interested in the topic, feel free to share the post with them.
Disclaimer:
I am not a financial or investment advisor. The content of this post represents my personal views and is purely informational. It should not be taken as financial or investing advice. Please do your own research and consult with a qualified financial advisor before making any investment decisions.
Details about TradingView affiliate link, according to the partner program:
- There is a $15 bonus for the referred user, which can be used for purchasing a TradingView paid plan
- In order to receive the bonus, you need to be a new user of TradingView
- If you sign up by using my affiliate link and purchase a paid plan through your web browser, I`ll be receiving an affiliate reward, which will help me support my blog
Data sources: for the fundamentals data (stock statistics, EPS, etc.) and the chart I have used tradingview.com. The numbers I have posted are taken from the mentioned source at the time of writing.
Some of the information may be generated by using AI. Always double check the information and do your own research.


Leave a comment