
Why I’m Writing This Analysis 🤔
In this post, I would like to take a closer look at FactSet and analyze its key fundamental metrics.
For regular readers of the blog, this name is not new. I started building a position in FactSet in October 2025. I have to admit that when I initially decided to invest, my analysis was rather superficial. A significant part of my decision was influenced by the fact that the stock price had already declined substantially.
In recent days, the market surprised me again and pushed the stock even lower.
Despite the drop, I have not sold my shares. On the contrary, I even added slightly to my position. Eventually, I decided to write this article to answer an important question for myself:
Was this investment a mistake, or does it still deserve a place in my portfolio?
Without further introduction, let’s begin.
Why Has FactSet’s Stock Declined? 📉
I would like to start with the reasons behind the price decline.
Based on my understanding and various publications I have read, a major concern is related to artificial intelligence potentially disrupting the company’s business model. I recently came across a phrase that I really liked. I am paraphrasing, but the idea was that the market is no longer pricing only AI growth, but also AI disruption.
I understand these concerns. I personally use AI tools and see how powerful and efficient they are.
In this article, I want to evaluate whether FactSet has been punished simply because it is perceived as a SaaS company in the AI era, or whether there is something fundamentally worrying beneath the surface.
For this analysis, as always, I will rely on data from Simply Wall St.

The banner contains my affiliate link. Check this post for additional information.
Revenue and Net Income Growth Over 10 Years 📊
Let’s begin with the company’s historical financial performance.
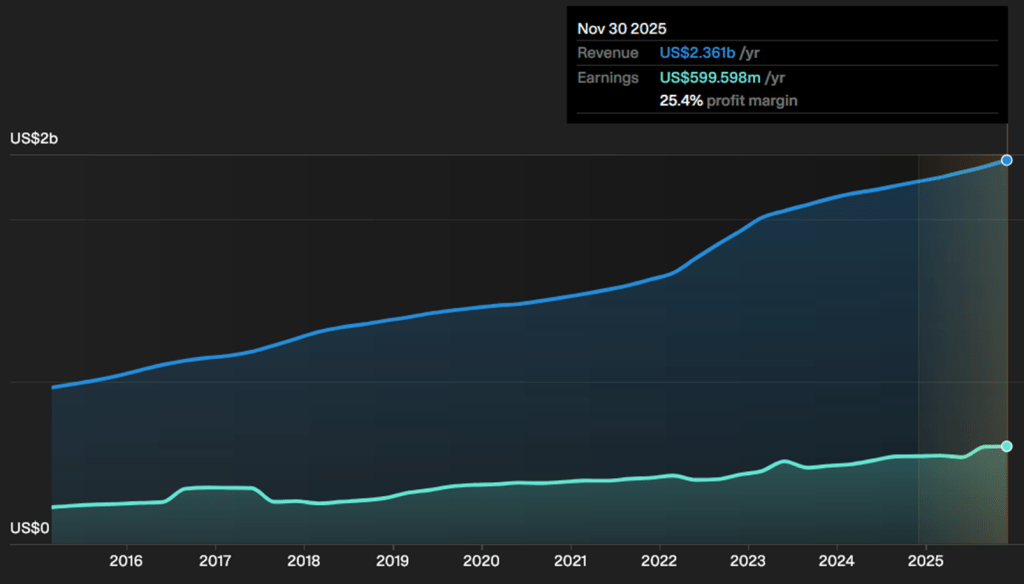
In February 2015, FactSet’s net income was approximately 224 million USD. According to the latest report from November 2025, net income is just under 600 million USD.
That represents roughly 167 percent growth over ten years, or slightly above 16 percent annualized growth.
This is not an explosive growth story. However, it reflects stability. What reinforces this perception is the absence of extreme fluctuations in the chart. Revenue and earnings growth appear steady and consistent rather than volatile.
This leads me to question whether the company previously deserved its high valuation multiple. Perhaps the premium P/E ratio was justified by a strong competitive moat. If that was indeed the case, the recent contraction in the P/E multiple could be explained by concerns that AI might weaken that moat.
At this point, the price decline begins to make more sense.
Current Valuation: Is FactSet Undervalued? 💰
Let’s now examine the current valuation metrics.
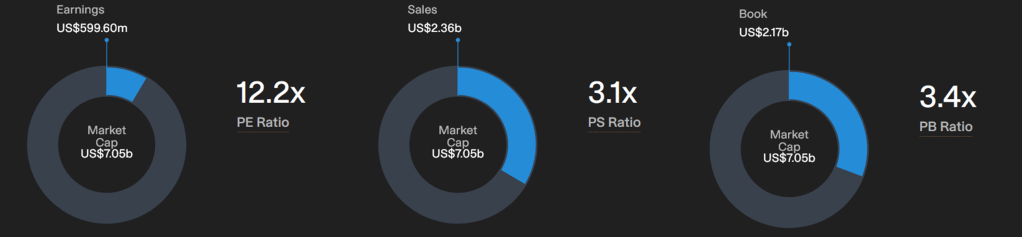
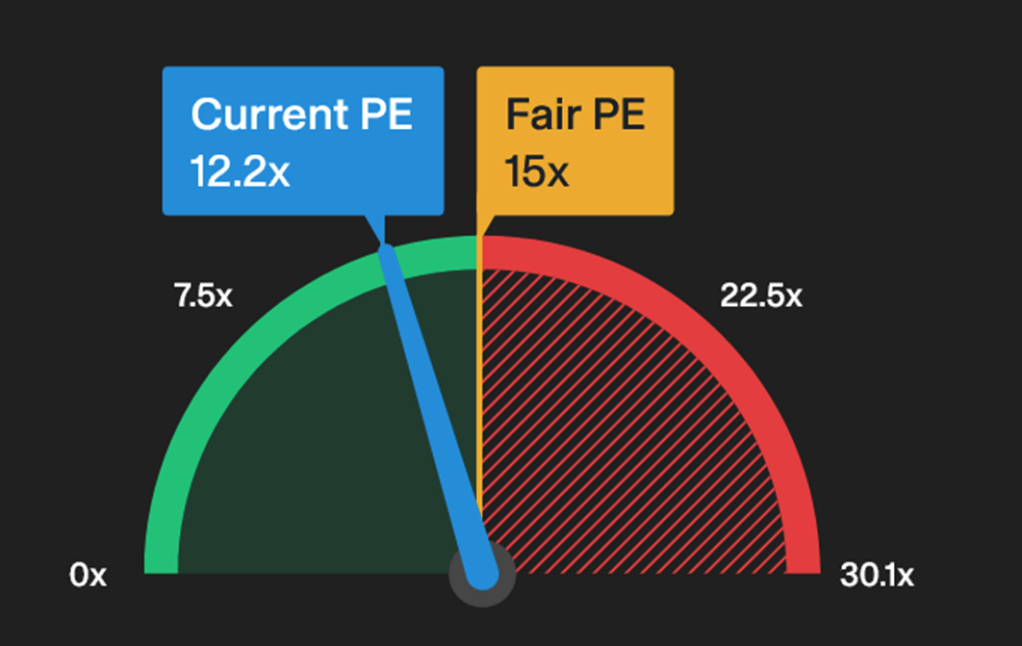
The P/E ratio stands at 12.2x. In my opinion, this multiple is appropriate for a mature company. Whether it is fair for FactSet specifically is harder to determine.
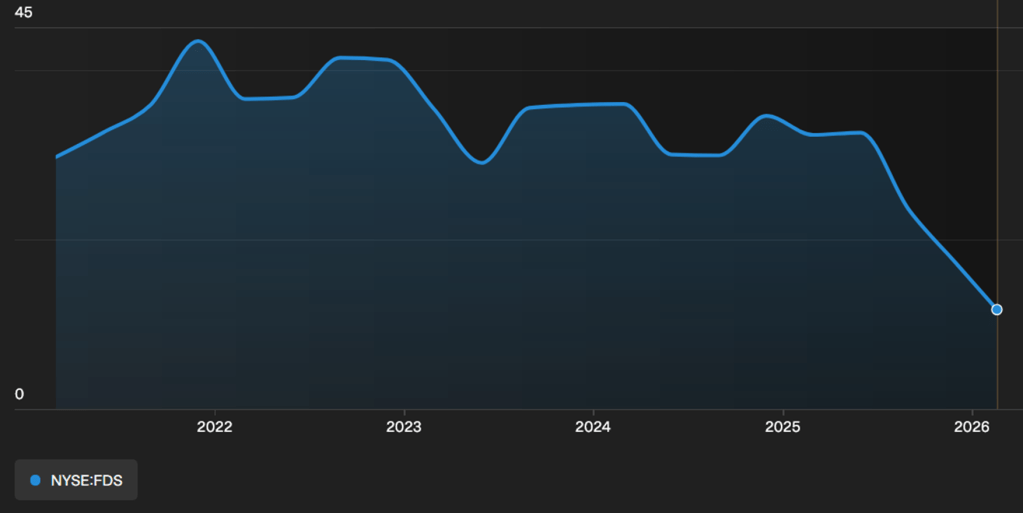
Looking at the historical P/E chart, this appears to be the lowest reading in the past five years. While historical comparisons alone should not be the main investment criterion, they do provide context.
This raises an important question:
Has the market overreacted?
Even if AI-related risks are justified, will disruption truly happen so quickly? Does the company have a strategy to defend its competitive position? Does its moat disappear overnight?
Unfortunately, these are questions without clear answers. The future remains uncertain.
As for the P/S and P/B ratios, they seem somewhat high for my personal preference. That said, they may be normal for this type of business. Consciously, I choose not to focus too heavily on them.
Profitability and Efficiency Metrics 📈
Now let’s turn to the efficiency indicators: ROE, ROA, and ROCE.
This is actually one of the areas that initially attracted me to the company.
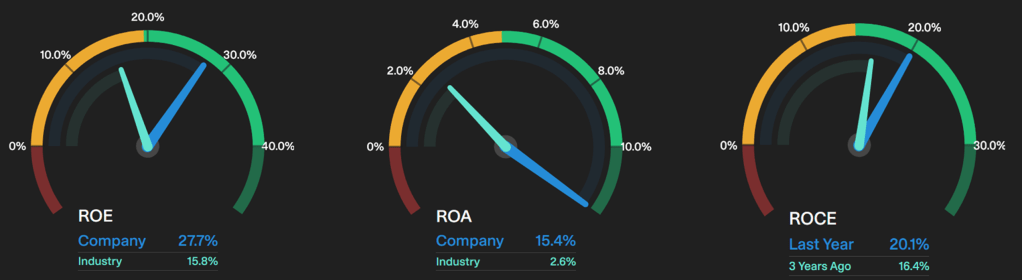
ROE stands at 27.7 percent, compared to the industry average of 15.8 percent.
ROA is 15.4 percent, while the industry average is only 2.6 percent.
These figures clearly show that FactSet significantly outperforms its peers in terms of capital efficiency.
Return on Capital Employed is 20.1 percent, up from 16.4 percent three years ago. This improvement suggests effective management execution.
Viewed in isolation, these numbers make the company very appealing. It is difficult not to feel confident about the business when looking at these metrics.
However, past performance is not enough. As investors, we care about the future.
Future Earnings Expectations 📅
According to analyst estimates, earnings are expected to grow.
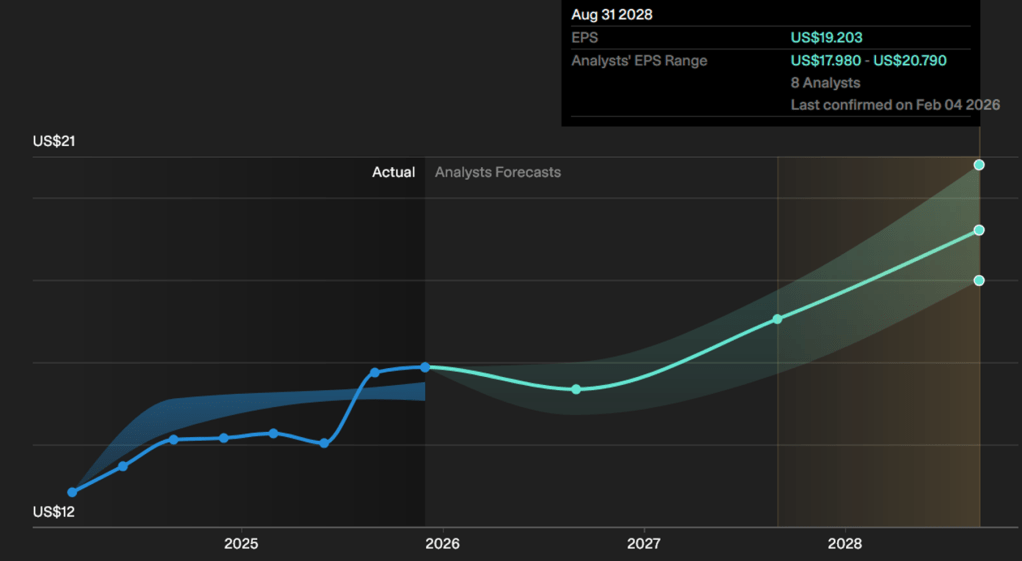
The average forecast for 2028 is earnings per share of 19.20 USD, compared to 15.87 USD in 2025. If that projection materializes, it implies approximately 7 percent annual EPS growth.
Growth is expected, which is encouraging. But valuation also depends on what multiple we assign to those future earnings.
Simply Wall St suggests a fair P/E multiple of 15x.
Let’s apply that multiple and try to project the price in 2028:
Base case:
19.20 x 15 = 288 USD
Bear case:
17.98 x 15 = 269.7 USD
Bull case:
20.79 x 15 = 311.85 USD
At the time of writing, FDS trades around 200 USD. From today’s price, these projections look reasonable.
However, my average entry price is 267.41 USD.
Under the bear case, I would roughly break even. In the base and bull scenarios, there would be modest gains. It is not a particularly comfortable position.
If we assume some P/E expansion to 18x, which is still below the industry average, the numbers improve:
17.98 x 18 = 323.64 USD in the bear case scenario.
Not perfect, but at least more reassuring.
Ultimately, much depends on whether AI will significantly damage the company’s moat or whether FactSet will adapt successfully.
Dividends and Shareholder Returns 💵
As regular readers know, I appreciate companies that reward shareholders.
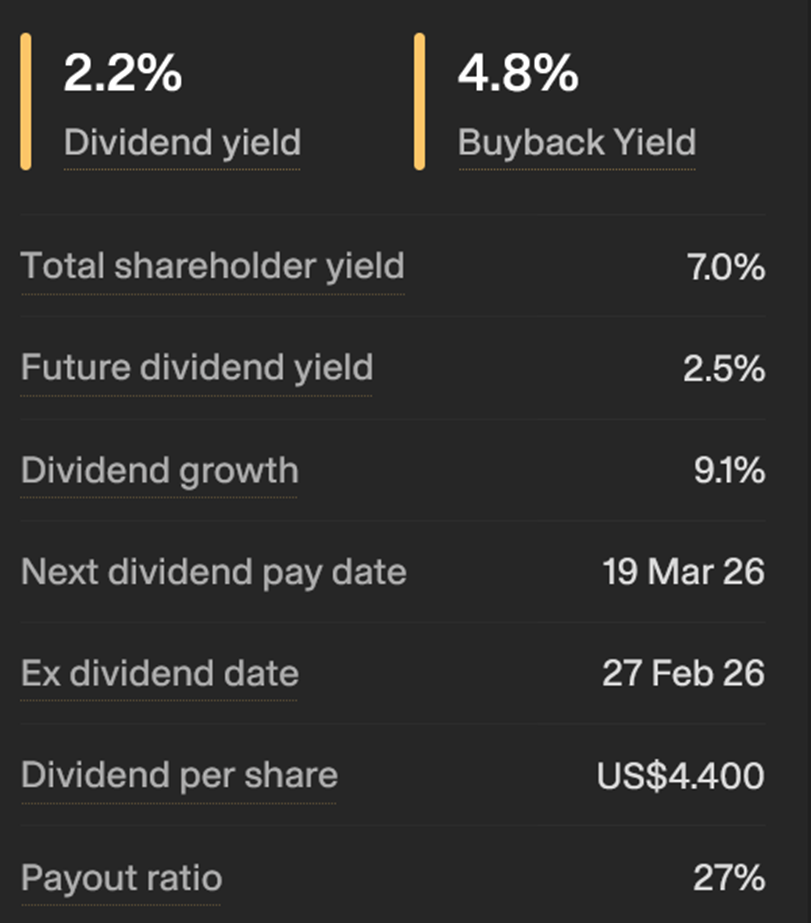
FactSet’s dividend yield is approximately 2.2 percent. Not spectacular, but respectable. The company is also active in share buybacks, with a buyback yield of 4.8 percent. Combined, that represents roughly 7 percent shareholder yield.
That is a solid figure.
Dividend growth stands at 9.1 percent, and the payout ratio is only 27 percent. This suggests the dividend is sustainable and potentially capable of further growth, assuming no major deterioration in fundamentals.
From a capital allocation perspective, I find this quite appealing.
Final Thoughts: What Will I Do? 🧠
Overall, I do not see fundamental weaknesses in the company.
Historically, FactSet has demonstrated solid revenue and earnings growth, strong profitability metrics, and reasonable shareholder returns. Analyst forecasts suggest continued growth.
The real issue is my entry price.
I was too impatient. I started buying during a busy period in my life and did not conduct a thorough analysis beforehand. Perhaps I relied on technical indicators. Perhaps I ignored the importance of a margin of safety.
Whatever the reason, the current price clearly indicates that my entry was not optimal.
What will I do now?
At this stage, I do not intend to sell my position. If the price remains around current levels by the time I receive my next paycheck, I may add slightly to reduce my average cost below 260 USD.
From there, I will give the company time.
I am aware that investing based on hope is not ideal. However, after reviewing the fundamentals and valuation, I still believe the market reaction may have been somewhat excessive.
Time will tell whether that belief is justified.
Closing Thoughts 🌱
If this article serves any purpose, it is to highlight the importance of conducting a thorough and timely analysis before investing.
Otherwise, we end up relying on hope to rescue our positions.
Thank you for joining me in this discussion. Despite the current underperformance of this position, it was a pleasure to share my thoughts.
If you found this analysis useful, consider subscribing to the blog. And if you have an opinion about FactSet, I would be grateful to read it in the comments.
Wishing you thoughtful, disciplined, and value-driven investments.
Until next time.
Keywords: FactSet stock analysis, FDS valuation, SaaS AI disruption risk, stock market fundamentals, P/E multiple analysis, dividend stock analysis, long term investing blog
Disclaimer:
I am not a financial or investment advisor. The content of this post represents my personal views and is purely informational. It should not be taken as financial or investing advice. Please do your own research and consult with a qualified financial advisor before making any investment decisions.
Disclaimer on the use of AI: Some of the information may be generated by using AI. Always double check the information and do your own research.


Leave a comment