
📘 My Thoughts on Lululemon (LULU)
I’m writing this post with a lot of excitement. On one hand, I get to share my thoughts with you again — and on the other, this is post number 50 on the blog. I consider this a personal milestone, especially since I managed to stay consistent even during some very intense work periods. Quality matters more than quantity (and I hope readers feel that), but I still wanted to mark the moment.
To honor the early spirit of this blog, I decided that my fiftieth post should once again be about a company I recently started buying — Lululemon (LULU). I won’t call this an analysis in the academic sense; rather, it’s a personal reflection on what I liked about the company and why I began building a position.
Let’s keep things tight and jump into the first thing that really stood out to me — the product.
🧵 The Product
Most people are familiar with what Lululemon does, but here’s a brief description:
“lululemon athletica inc., together with its subsidiaries, designs, distributes, and retails technical athletic apparel, footwear, and accessories for women and men. The company offers pants, shorts, tops, and jackets for activities such as yoga, running, training, and more. It also provides fitness-inspired accessories.”
Speaking honestly — like many men — the product that first caught my attention was the company’s yoga pants for women. I’m sure most men have at least once seen a photo of someone wearing them. Beyond that, I talked to friends who actually use Lululemon products. Everyone I spoke with praised the quality and said they’d buy again.
Following Peter Lynch’s advice, I decided to dig deeper into a business I was already familiar with from a consumer standpoint. Product insight is great, but it has to be backed by financial strength, so I dove into the numbers.
Before commenting on fundamentals, a quick note: the infographics below come from Simply Wall St. As regular readers know, I’m both a fan and an affiliate. Using my link gives you an extended Premium trial and 30% off the first paid plan — though I’m not sure how long the offer will last.

The banner contains my affiliate link. Check this post for additional information.
📊 Revenue and Earnings Growth
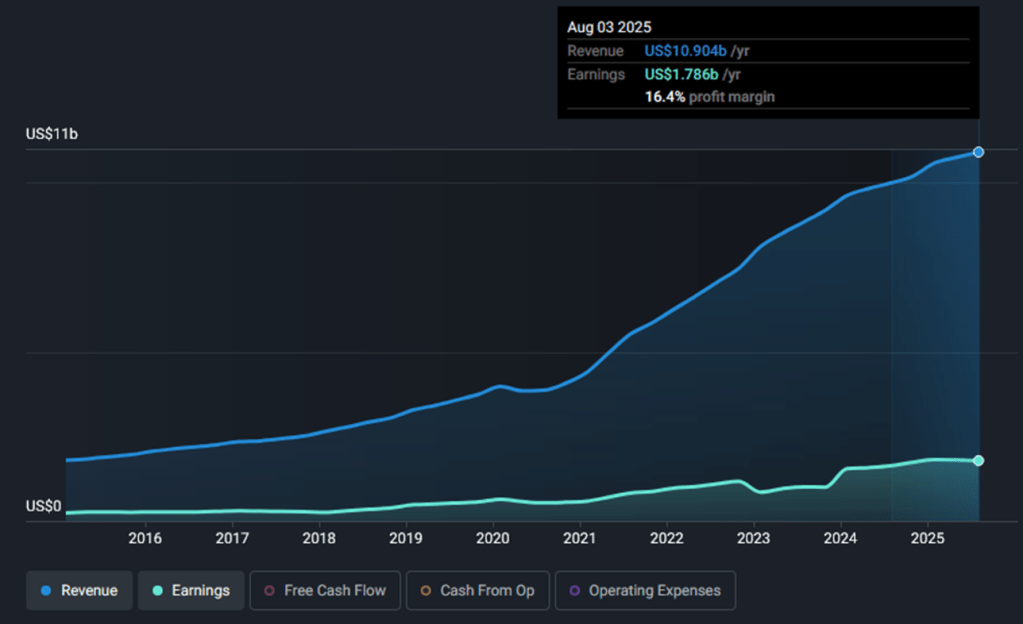
Looking at the revenue and earnings chart, the performance over the past ten years has been impressive. In February 2015, annual profit was around $239 million. By August 2025, profits had grown to just under $1.8 billion — a roughly 647% increase over a decade. That’s remarkable growth.
💵 Free Cash Flow
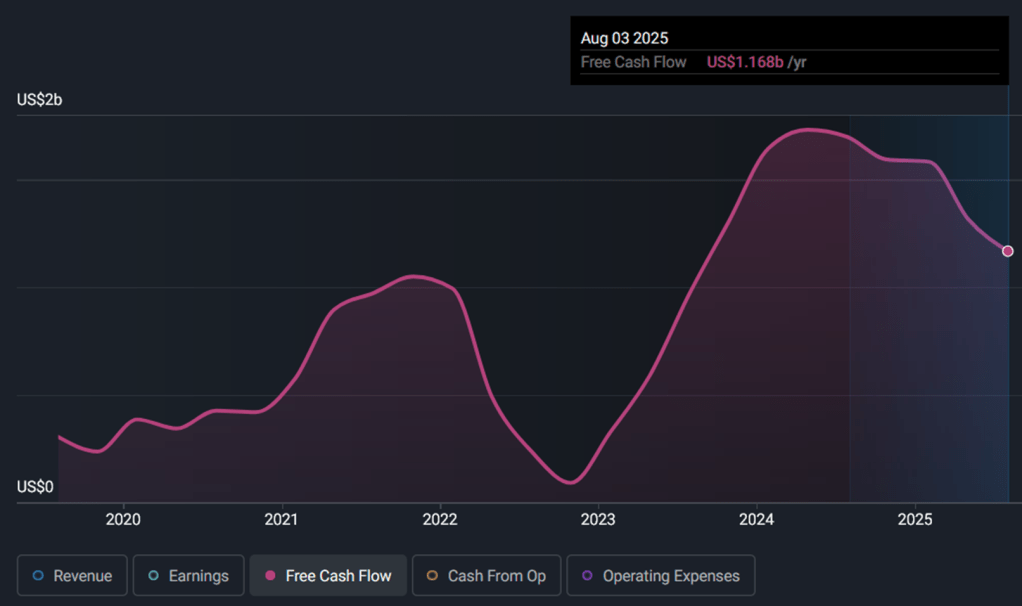
Next, I looked at free cash flow from 2019 to 2025. It grew from about $305 million to roughly $1.16 billion — even after a slight dip from peak levels. Then I calculated the Price to Free Cash Flow ratio using the company’s market cap of $20.1 billion and its FCF of $1.168 billion. The result was just above 17 — not screaming “undervalued,” but reasonable, and likely fair.
So far, revenue growth, profit growth, and free cash flow trends all looked solid.
📉 Stock Price Performance

My affiliate link. Sign up by using it and enjoy 15 USD bonus. Full details below.
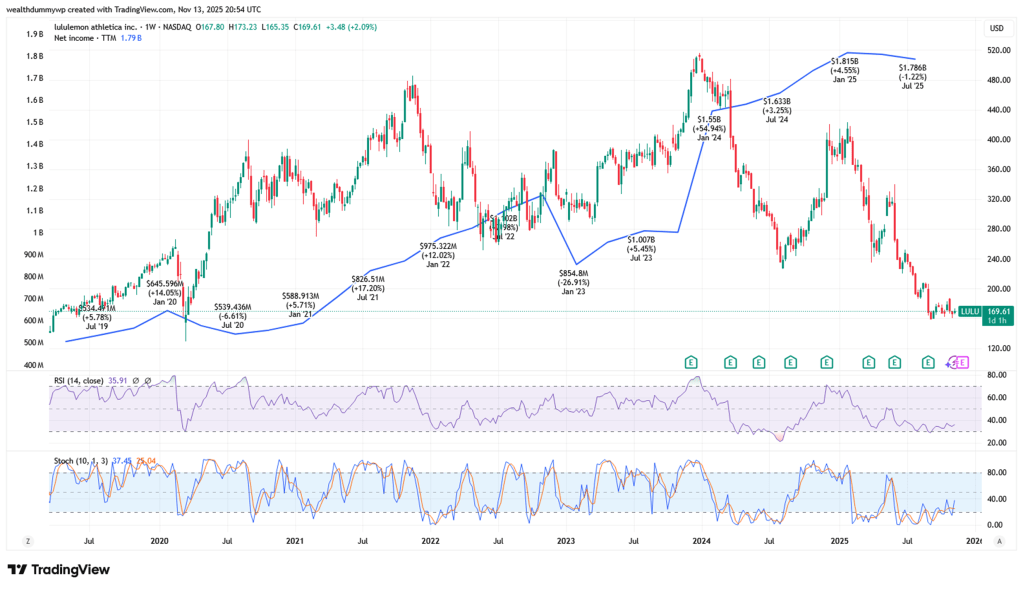
Here’s where things get interesting. Despite strong financial performance, the stock price has fallen significantly. Based on what I’ve read, investors are concerned about weaker consumer spending, increased competition, and tariff-related pressures. These risks are real, but I’m hopeful that a company with such a strong history can navigate them.
Investing always involves uncertainty, and this is a risk I’m choosing to take — while keeping a close eye on future earnings.
📈 Profitability Ratios
Lululemon’s profitability metrics were another major positive surprise:

- Return on Equity (ROE): 40.7% vs. industry average of 11.3%
- Return on Assets (ROA): 23.7% vs. 6.2% industry average
- Return on Capital Employed (ROCE): 41.8%, slightly higher than three years prior
These are exceptionally strong numbers — clear indicators that the company is doing something very right operationally.
📦 Other Highlights (“Miscellaneous”)
One of the most impressive things I saw was the balance sheet:
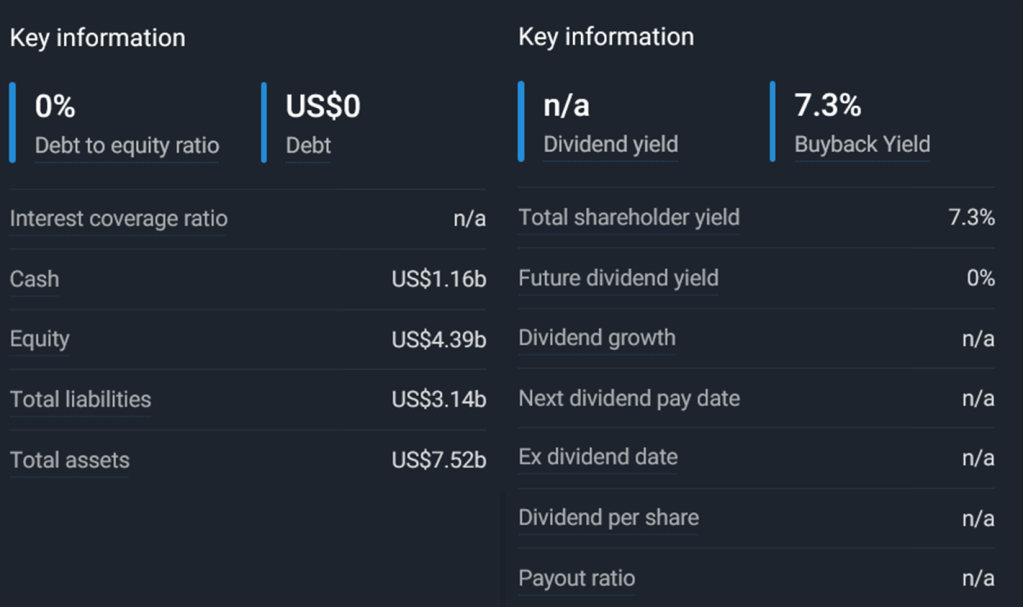
Lululemon has no debt and over $1 billion in cash. Finding a debt-free company of this size is rare, and it gave me even more confidence.
On the dividend side — there is none. Normally, I love dividend stocks, so this wasn’t ideal. But then I saw the buyback yield of 7.3%, which I liked a lot. At that level, I’m perfectly fine with the company choosing buybacks over dividends.
🔮 Future Earnings & Valuation
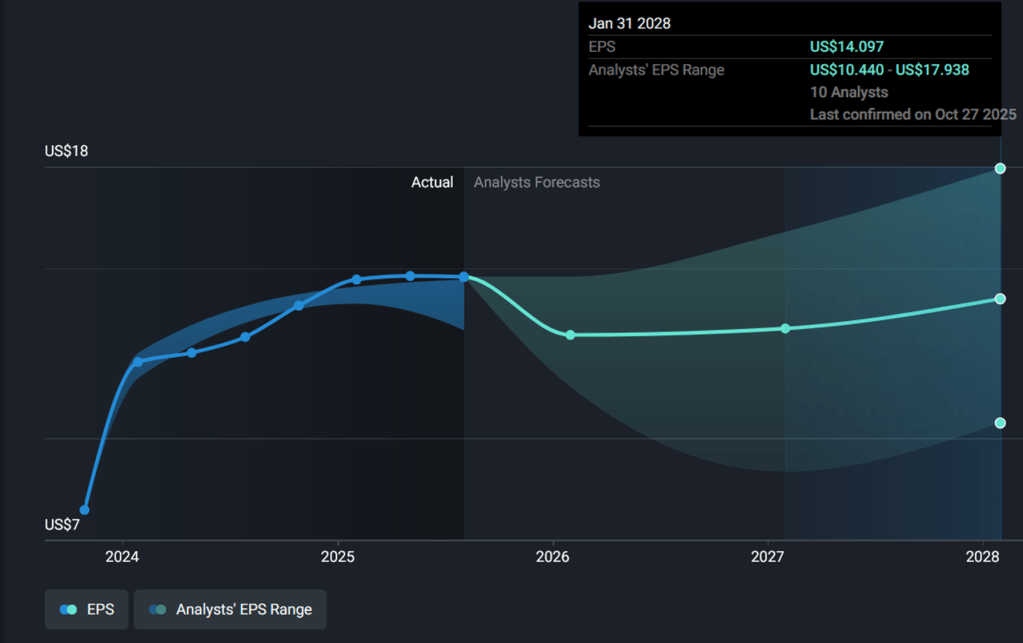
Analysts project slightly lower EPS for 2028 compared to current levels. The latest reported EPS is $14.74, and the average forecast for 2028 is $14.097 — with a wide range, suggesting lack of consensus.
Using Simply Wall St’s fair P/E estimate of 15.6x, the valuation math looks like this:
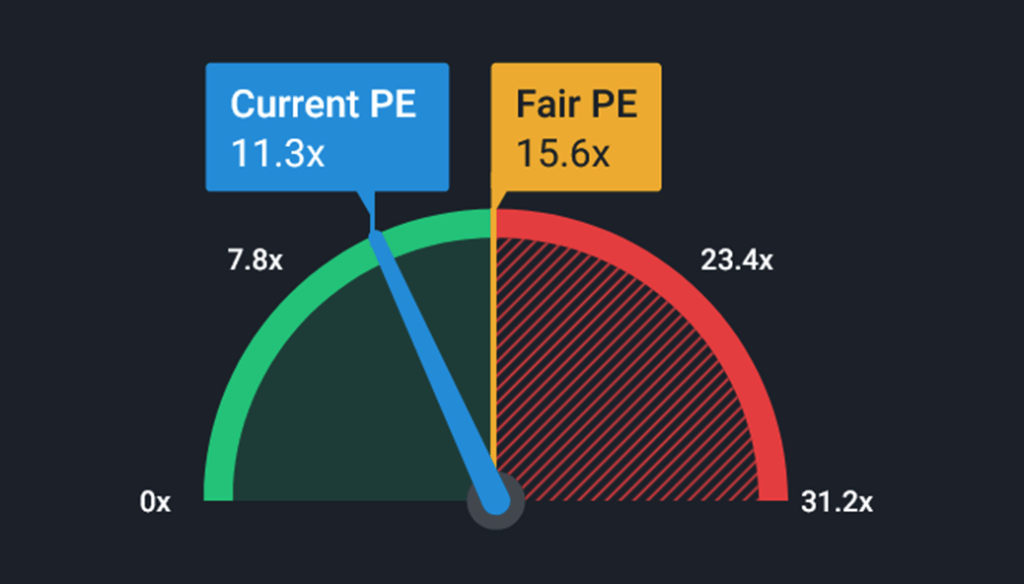
- Base scenario:
$14.097 × 15.6 = $219.91 → ~29% potential upside over 3 years - Bear case (EPS $10.44):
$10.44 × 15.6 = $162.86 → ~5% downside - Bull case (EPS $17.93):
$17.93 × 15.6 = $279.71 → ~65% upside
These scenarios helped me understand the risk-reward balance — and in my view, the odds lean in my favor.
🧠 Conclusion
To summarize what I liked most about Lululemon:
- A strong, well-known product with loyal customers
- Excellent long-term growth in revenue, earnings, and free cash flow
- A stock price declining while profits rise — sometimes an opportunity
- Exceptional profitability ratios
- A clean balance sheet with no debt
- Healthy buyback yield
- Reasonable risk distribution across future scenarios
My average purchase price is $174.20, placing me at about a 3% unrealized loss at the moment. It’s currently my second-largest position in the portfolio I share on the blog. Would I keep buying? If the price falls further — yes, definitely. If it stays around current levels — maybe.
🔄 A Quick Note on FMC
I also closed about 25% of my FMC position. As mentioned in my previous post, I plan to realize the loss to offset gains elsewhere. I promised I’d update you once I took action — and here it is.
The freed-up capital has already been reinvested into another company. I won’t reveal the name yet, but it’s a well-known business whose stock price recently dropped significantly. You’ll see it in the portfolio review soon — so if you don’t want to miss it, make sure you’re subscribed to the blog.
I hope this post was helpful and interesting. I’d love to hear your thoughts about Lululemon in the comments below.
Wishing you successful and meaningful investing — until next time!
Keywords: Lululemon stock analysis, LULU review, investing blog, stock market insights, free cash flow analysis, profitability ratios, portfolio update, Lululemon valuation, long-term investing, LULU stock
Disclaimer:
I am not a financial or investment advisor. The content of this post represents my personal views and is purely informational. It should not be taken as financial or investing advice. Please do your own research and consult with a qualified financial advisor before making any investment decisions.
Disclaimer on the use of AI: Some of the information may be generated by using AI. Always double check the information and do your own research.
Details about TradingView affiliate link, according to the partner program:
- There is a $15 bonus for the referred user, which can be used for purchasing a TradingView paid plan
- In order to receive the bonus, you need to be a new user of TradingView
- If you sign up by using my affiliate link and purchase a paid plan through your web browser, I`ll be receiving an affiliate reward, which will help me support my blog


Leave a comment