
In a previous blog post, I shared the current diversification of my “public” investment portfolio. Back then, I mentioned that I wanted to pay more serious attention to the energy sector—because, at that time, I had zero exposure to it in this portfolio. Just to clarify, I do hold positions in energy companies within my main portfolio, but I also want the public one to be well-diversified.
I’ve had my eye on two stocks in the clean energy space that I believe hold solid long-term potential. Actually, there’s a third one too—but I’m not convinced by its current valuation just yet. In today’s post, I’ll dive into one of these companies. I’ll cover the other one in a future article, so make sure you’re subscribed to the blog to stay updated when that drops.
Let’s get into it.
Company Overview: What Is First Solar?
The company we’ll be analyzing today is First Solar (ticker: FSLR). Here’s a quick snapshot of what they do:
First Solar, Inc. is a solar technology company providing photovoltaic (PV) energy solutions in the United States, France, India, Chile, and other international markets. The company manufactures and sells PV solar modules using thin-film semiconductor technology—offering a lower-carbon alternative to traditional crystalline silicon modules. It also designs, manufactures, and sells cadmium telluride (CdTe) solar modules that convert sunlight into electricity.
So yes, we’re talking about a pure solar energy play. While the renewable energy sector has seen a lot of downward pressure lately, I still believe there’s significant potential in this space. I’m well aware that this is not the kind of stock to deliver short-term results—but that’s totally fine with me. I’m in it for the long haul.
The other energy stock I plan to add has an established business model and even pays a dividend. Together, I think they’ll form a well-balanced energy allocation in my portfolio.
But let’s turn back to First Solar and take a deeper look at the fundamentals.
All the visuals for the fundamental analysis are provided by:

Revenue and Net Income: A Mixed Picture
As always, I like to kick off my analysis by looking at revenue and net income trends over time.
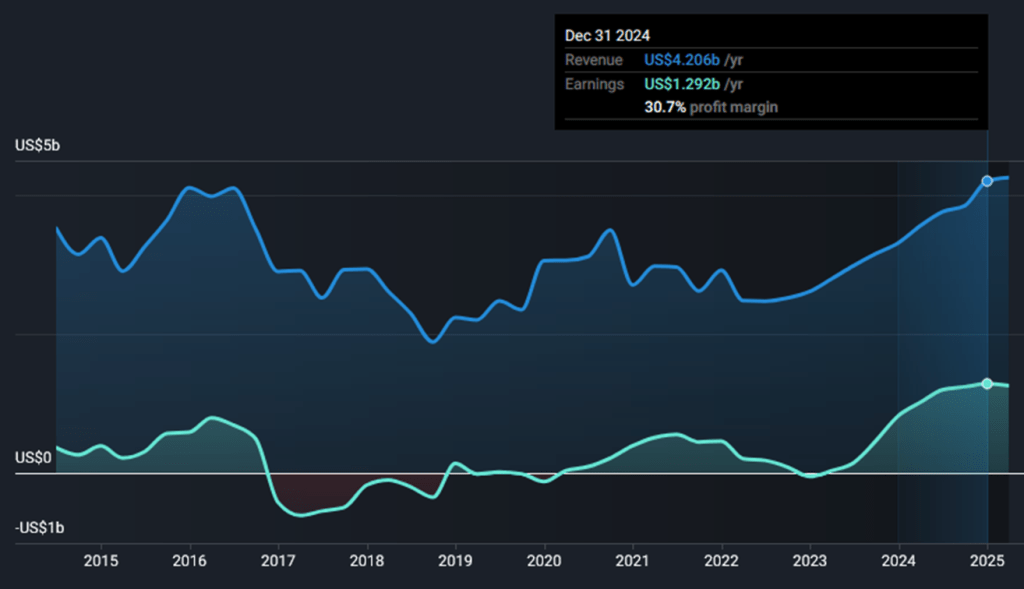
From the chart, we have data going back to 2014. At the end of that year, First Solar reported $3.391 billion in revenue and a net income of about $396 million.
Fast forward to December 31, 2024: revenue grew to $4.20 billion, and net income jumped to approximately $1.29 billion.
Over this 10-year period, revenue increased by about 23.85%, while net income skyrocketed by 225%.
To be honest, I’m not exactly blown away by the revenue growth. Sure, it’s an increase, but nothing remarkable. In fact, it raises some concerns. On the other hand, the sharp growth in net income is genuinely impressive—and something I like to see in a company.
So what’s behind this disconnect between revenue and earnings?
At first glance, it seems tied to net profit margin. In 2014, First Solar had a margin just under 12%. By 2024, it had jumped to 30.7%—a massive improvement. From what I can tell, this isn’t typical for the company historically. Margins above 25% only appeared starting in late 2023.
The big question: Can First Solar sustain this level of profitability moving forward?
Let’s dig deeper into the breakdown of revenue and expenses.
Revenue and Expense Breakdown: Focused but Profitable
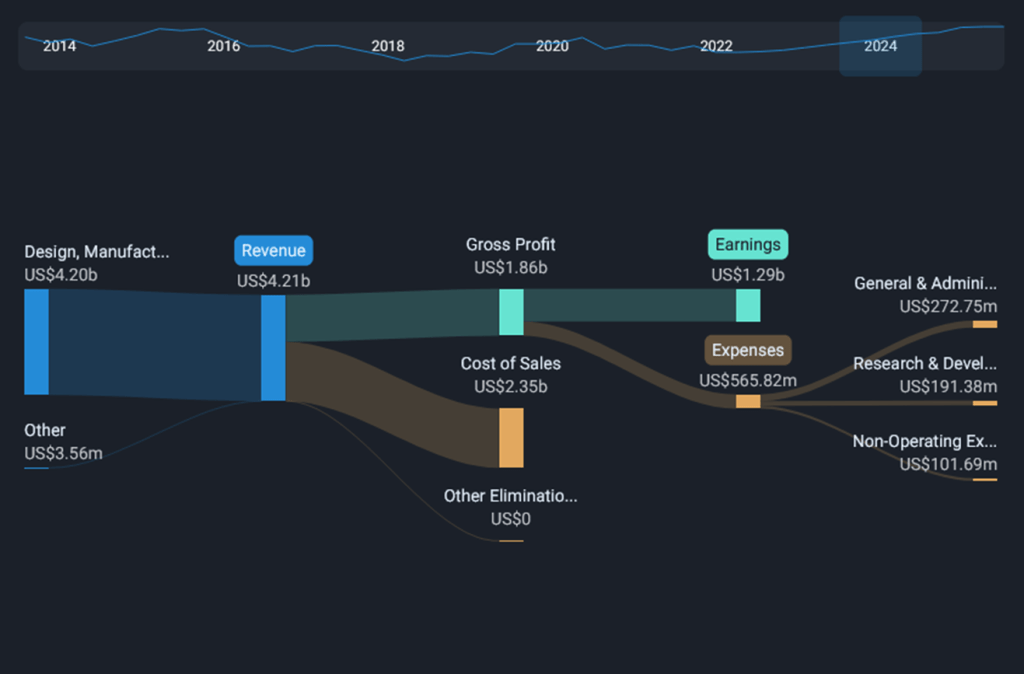
Starting with the revenue side, the chart shows that First Solar’s income comes entirely from one business segment: Design, Manufacture, and Sale of CdTe Solar Modules. There’s no revenue diversification here.
Normally, I prefer companies with multiple revenue streams. However, if a company is highly specialized and has a competitive edge, that focus can actually be a good thing. In this case, it just means that First Solar’s performance will heavily depend on how this particular segment evolves.
On the expense side, let’s look at gross margin. For 2024, gross margin stood at 44.18%—one of the highest in the company’s history.
For comparison:
- In 2018, it was 17.51%
- In 2014, it was 24.33%
So we’re clearly seeing a major margin expansion over the past decade. That, combined with modest revenue growth, is likely a key driver of the earnings surge. It’s not clear if these improvements are permanent, but they’re certainly noteworthy.
As solar technology becomes more widespread and manufacturing costs decline, there’s a plausible argument for sustained high margins in the future. Time will tell—but this is definitely a metric I’ll be monitoring closely.
Profitability Ratios: Standing Out in the Sector
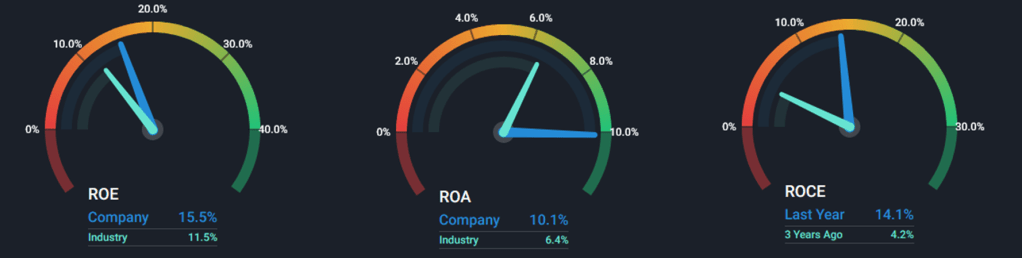
Let’s now look at key profitability ratios—ROE, ROA, and ROCE.
- Return on Equity (ROE) is currently at 15.5%, versus an industry average of 11.5%. That’s a positive sign. While 15.5% isn’t extraordinary in absolute terms, outperforming the sector average is what matters here.
- Return on Assets (ROA) sits at 10.1%, again beating the industry average of 6.4%. Another win.
- Return on Capital Employed (ROCE) has improved significantly—from 4.2% three years ago to 14.1% today. This could point to more efficient capital allocation from management, which I always appreciate as a long-term investor.
In summary: based on these profitability ratios alone, First Solar appears to be a fundamentally sound company that’s outperforming its peers. If you believe in the long-term growth of the solar sector, this stock might be worth a closer look.
Valuation Metrics: Is First Solar Undervalued?
Now let’s talk valuation—what are we actually paying for this business?
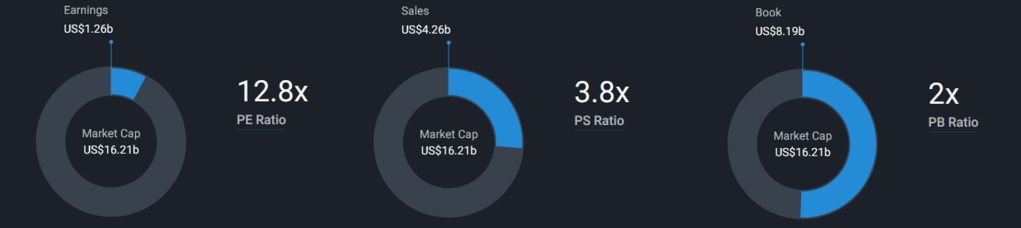
Starting with the Price-to-Earnings (P/E) ratio:
- Current P/E: 12.8x
- Forward P/E: 8.7x
As a value-oriented investor, I like what I see. A forward P/E under 10 suggests that the market expects continued growth at a bargain price.
Let’s check the other two valuation metrics:
- Price-to-Sales (P/S): Currently 3.8x, with a forward P/S of 2.9x. That’s a bit expensive for my taste, but still reasonable—especially when you consider the sector average is 3.6x.
- Price-to-Book (P/B): At 2x, this is well within my preferred range (I usually look for anything under 2.0).
Next, how does First Solar stack up against competitors?
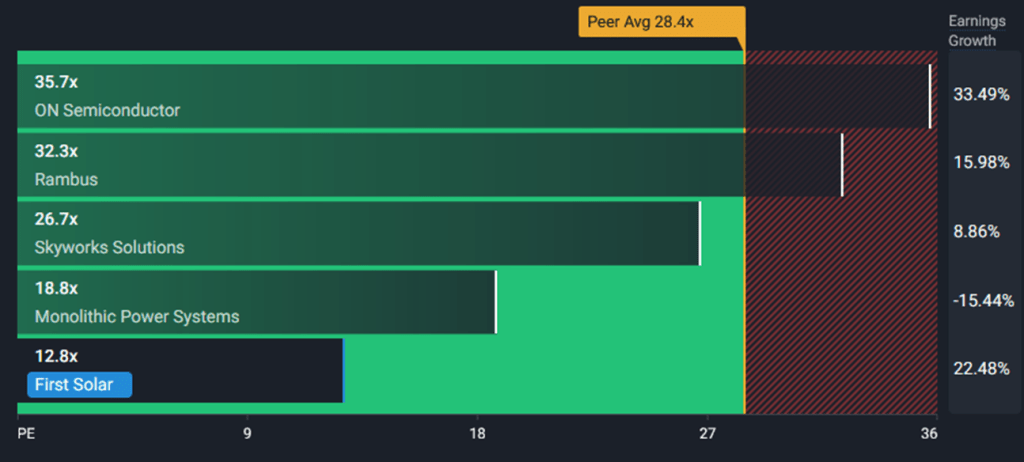
First Solar’s P/E of 12.8x is the lowest among its peers, where the average sits at 28.4x.
And relative to the sector as a whole?
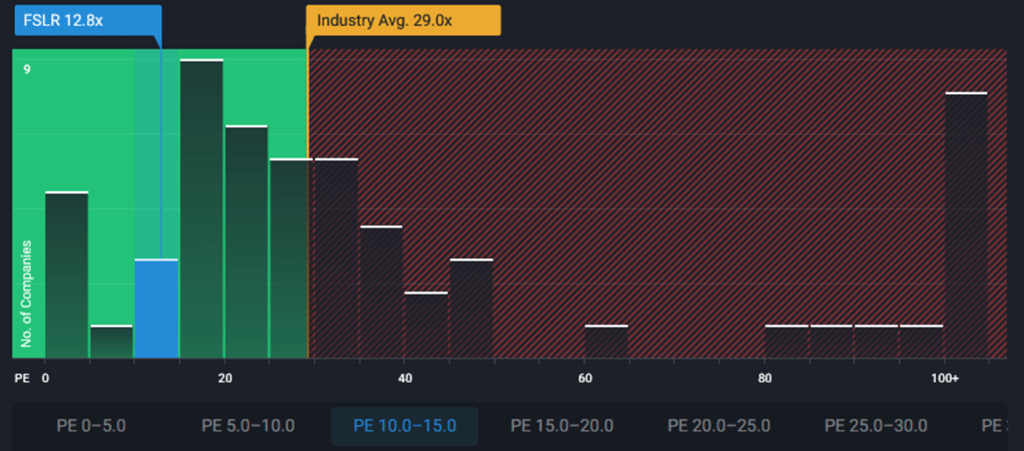
Again, First Solar appears undervalued. The average P/E for the industry is 29.0x, more than double FSLR’s current ratio.
So, from a valuation perspective, First Solar looks like a solid deal—especially for investors seeking exposure to clean energy at a reasonable price point.
Future Expectations: What Analysts Are Predicting

Let’s take a peek into the future.
According to analysts, First Solar’s earnings per share (EPS) are expected to grow steadily. By the end of 2027, projections range between $19.03 and $34.53, with an average estimate of $27.49.
Let’s run a quick (and conservative) valuation exercise based on the lower bound of these estimates.
If we take the low-end EPS forecast of $19.03 and apply a 20% margin of safety, we get an adjusted EPS of $15.22.
Now, let’s assume a modest P/E multiple of 15—which is higher than the current one, but still significantly below the industry average.
$15.22 x 15 = $228.30
As of this writing (June 24, 2025), First Solar is trading at $152.50. That implies a potential upside of nearly 50% over the next two and a half years. Personally, I find that quite compelling.
Technical Analysis: Neutral Signals, But Opportunity Lingers

My affiliate link. Sign up by using it and enjoy 15 USD bonus. Full details below.
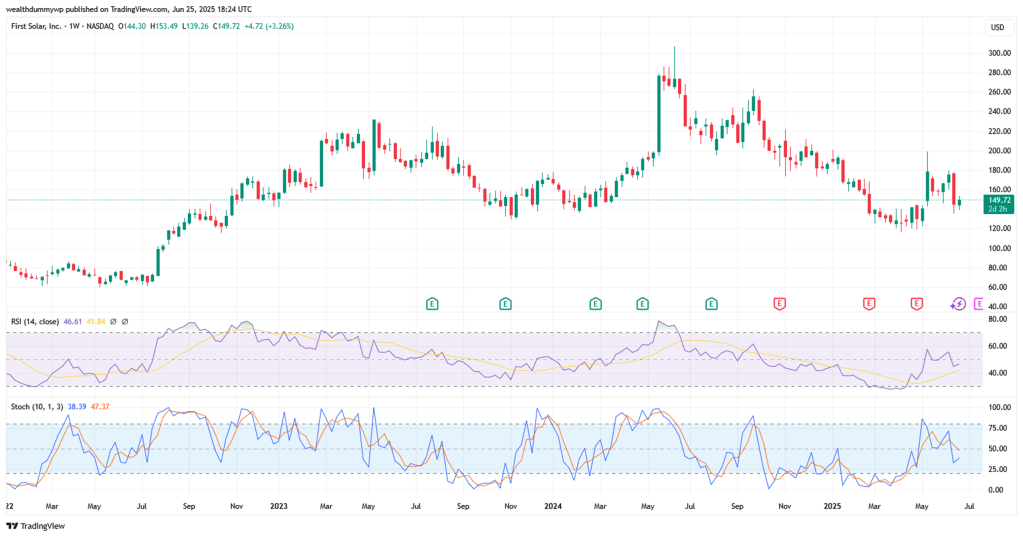
Looking at the weekly price chart, First Solar is trading well below its previous highs. That’s not a buy signal in itself, but it can be an opportunity if supported by other indicators.
I use RSI and Stochastic Oscillator as part of my technical analysis, and currently, both indicators are in a neutral zone. I generally prefer entering positions when at least one of them shows clear bullish momentum.
That said, it looks like FSLR recently hit resistance around $153. It’ll be interesting to see if it can break through.
From a technical standpoint, I don’t see a strong signal right now—but the fundamentals suggest it may still be a good entry point.
My Thoughts: Why I’m Buying First Solar
If you’ve read this far, it’s probably obvious that I like what I’m seeing.
I want to gain exposure to the clean energy sector, and First Solar checks a lot of the boxes: improving profitability, strong balance sheet, favorable valuation, and potential long-term upside.
The only remaining question was—at what price?
Based on my conservative valuation, I’ve decided to start building a position in FSLR as long as the price stays below $165. If my assumptions are correct, that could mean a projected return of around 38.36%, or roughly 15% annually—which I’d be more than happy with.
And to be fully transparent: while writing this post, I became convinced enough to take action.
I sold a small position in Merck (MRK)—a stock I still like and hold in another portfolio—and used the funds to buy First Solar at $153.81. Now, I’m hoping the price stays under $165 until my next paycheck, so I can increase my position further.
Thanks for reading—here’s to smart, long-term investing. Until next time!
If you enjoy reading my posts and find them useful, please consider subscribing to my blog. This way you`ll be notified as soon as I post something new. If you believe that someone may be interested in the topic, feel free to share the post with them.
Keywords: first solar stock analysis, FSLR investment, clean energy stocks 2025, undervalued solar companies, best renewable energy stocks, long-term stock picks, FSLR valuation, solar power investing, best energy stocks, growth stocks 2025
Disclaimer:
I am not a financial or investment advisor. The content of this post represents my personal views and is purely informational. It should not be taken as financial or investing advice. Please do your own research and consult with a qualified financial advisor before making any investment decisions.
Disclaimer on the use of AI: Some of the information may be generated by using AI. Always double check the information and do your own research.
Details about TradingView affiliate link, according to the partner program:
- There is a $15 bonus for the referred user, which can be used for purchasing a TradingView paid plan
- In order to receive the bonus, you need to be a new user of TradingView
- If you sign up by using my affiliate link and purchase a paid plan through your web browser, I`ll be receiving an affiliate reward, which will help me support my blog


Leave a comment