
Hey everyone! Let’s dive into the world of pharmaceuticals, specifically focusing on stocks of companies operating in this sector.
It’s true that the stocks of larger companies in this sector often don’t have the flash and excitement of a rapidly growing tech company. However, in my opinion, they definitely deserve a place in a well-rounded portfolio, bringing a certain level of stability. This is especially important for investors like me who aim to build a portfolio that can perform well under any economic conditions. Ray Dalio famously calls this type of portfolio an “All Weather” portfolio.
As I mentioned, these types of companies can provide a degree of stability to your investments. Given the increased uncertainty in the economic climate, I decided that this is precisely what my portfolio needed. I found a suitable candidate in Merck, ticker symbol MRK. In my previous post, I promised we’d analyze the company together, and the time has come.
We’ll explore both the fundamental and technical analysis, and at the end of this post, I’ll share my latest market moves with you. So stick around, and let’s get started!
A Quick Word About Merck
Merck & Co., Inc. (ticker MRK) is a global healthcare company that is primarily engaged in the research, development, manufacturing, and marketing of a broad range of pharmaceuticals, vaccines, and biologic therapies. Its business model focuses on innovative drug development targeting critical health needs, including oncology, infectious diseases, and immunology. By leveraging cutting-edge science and technology, Merck aims to provide transformative solutions to improve patient outcomes while sustaining long-term growth and profitability.
All the visuals for the fundamental analysis are provided by:

Revenue and Net Income: A 10-Year Overview
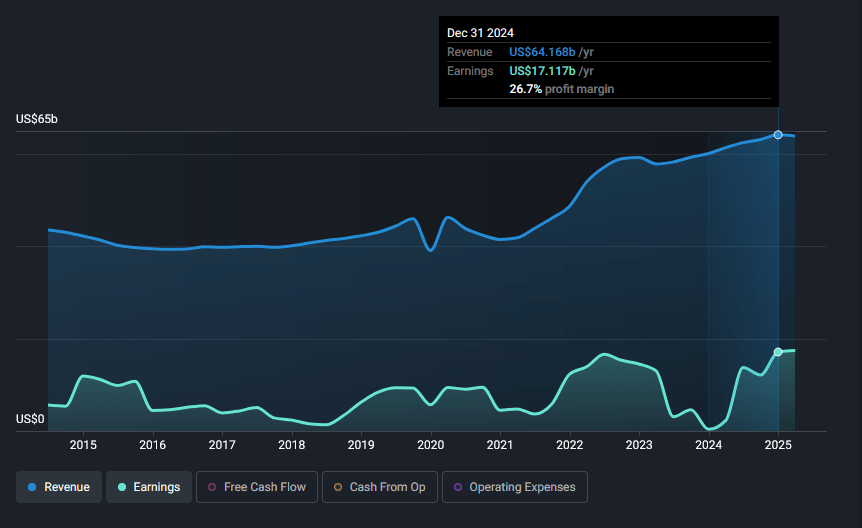
Looking at the graph, we can see significant revenue growth over the past 10 years. At the end of 2015, revenues were $39.498 billion, and by the end of 2024, they reached $64.168 billion. Over the period under review, this represents an increase of about 62.45%. It’s not an extraordinary achievement, but it’s still growth.
It’s important to keep in mind that we’re talking about a mature company here, not a high-growth one. In that context, I think the performance is decent.
We can also see growth in net income. At the end of 2015, the net profit was $4.442 billion, and by the end of 2024, it reached $17.117 billion. The growth in this metric is significantly higher than that of revenue. In percentage terms, net income increased by 285% over the period. That’s impressive!
In my opinion, this is largely due to improved profitability ratios, but we’ll get to those a bit later.
What concerns me in this graph is the significant fluctuation in net income. The revenue trend seems smoother. To me, this suggests that the company is having difficulty maintaining high levels of profitability ratios. It’s definitely something I’ll be watching closely.
Revenue and Cost Breakdown for 2024
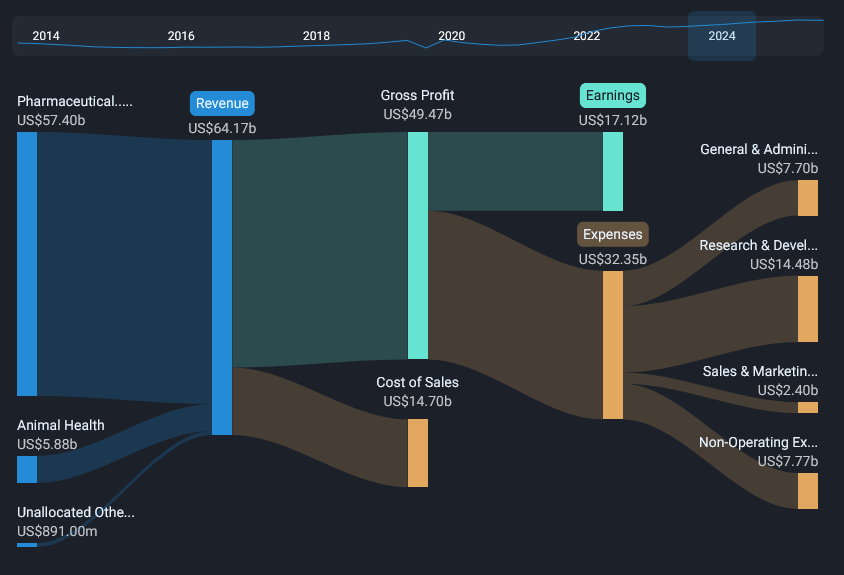
This chart clearly shows how the company’s revenues are diversified. The majority of revenues (89.5%) come from the pharmaceutical business. Animal Health contributes 9.2% of total revenues. Both segments have shown growth over the years. The pharmaceutical business is the main reason I bought shares in the company, but it’s good to see some, albeit slight, diversification.
The chart shows that the cost of goods sold does not take up a large portion of revenues. After deducting these costs, the gross profit for 2024 is $49.47 billion. This means that Merck maintained a gross margin of around 77% in 2024. An impressive figure, but its sustainability remains to be seen.
The fact that a significant amount remains as gross profit is positive, as the company can use these funds for further development. The chart shows that this is exactly what they’re doing. In 2024, research and development expenses were $14.48 billion. This represents about 29% of gross profit. These investments could lead to even better business performance in the future.
Looking back at previous years, we can see that the company maintains significant levels in this area. In some years, the percentage of R&D expenses relative to gross profit is higher than 30%. This is good on one hand, as it can lead to better development of the company. On the other hand, it means less money is available to be returned to shareholders in the form of dividends and buybacks. Each investor must decide for themselves what is important to them.
Profitability Ratios: A Deeper Dive
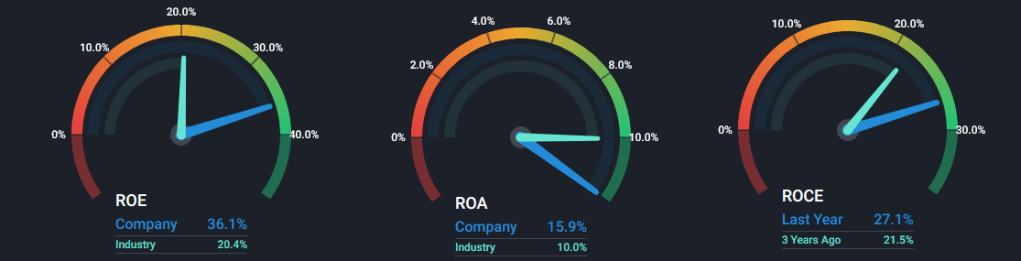
The chart above shows the latest values of three key return ratios – return on equity (ROE), return on assets (ROA), and return on capital employed (ROCE).
Looking at ROE, we see that the company achieves 36.1%, compared to an industry average of 20.4%. For ROA, Merck has 15.9%, compared to an industry average of 10%. In my opinion, both are very good achievements and show that the company is performing better than most of its competitors.
We see an improvement in ROCE. The figure three years ago was 21.5%, while the latest is 27.1%. To me, this indicates a better use of invested capital.
Regarding profitability ratios, it’s worth mentioning that in the latest reported earnings on March 31, 2025, Merck achieved a 77.07% gross margin and a 27.27% net profit margin. While these values are impressive, it’s important to remember that the company has had lower performance in these metrics in the past. There’s no guarantee they will be able to maintain them. I note this as something to watch in future earnings reports.
Valuation Metrics: Is Merck a Bargain?
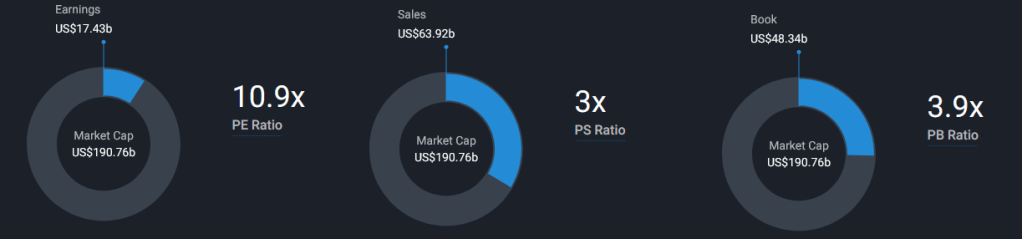
According to these ratios, Merck probably doesn’t fall into Benjamin Graham’s “cheap company” category. The exception is the price-to-earnings (P/E) ratio. The reported 10.9x suggests that the shares may be trading at a reasonable price. Price-to-sales (P/S) and price-to-book (P/B) are a bit high for my preference, which is normal given that I follow Graham’s recommendations. However, I decided to overlook this because the company impressed me with its profitability results.
To get a better view of the situation, it’s helpful to compare Merck’s valuation to its competitors:
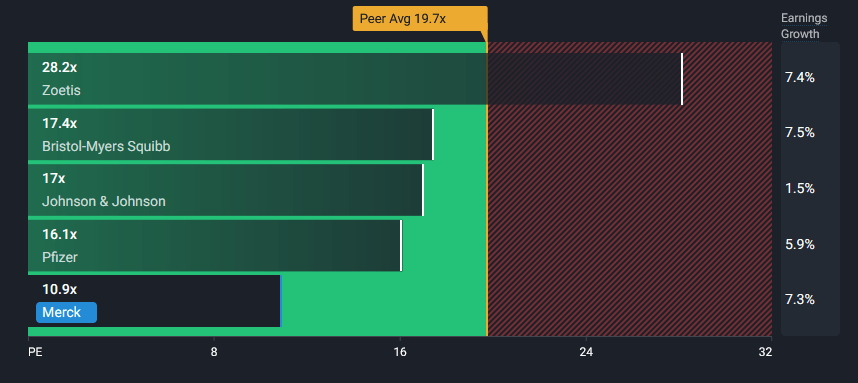
If we look at the P/E ratio in isolation, we see that Merck is the cheapest in the sample. This is despite the fact that its earnings growth rate is no worse than that of its competitors. The industry average for this ratio is 19.7x. Based on this data, and with the caveat that we are looking at P/E in isolation, we can say that Merck’s shares may well be undervalued.
Future Expectations: Projecting Growth
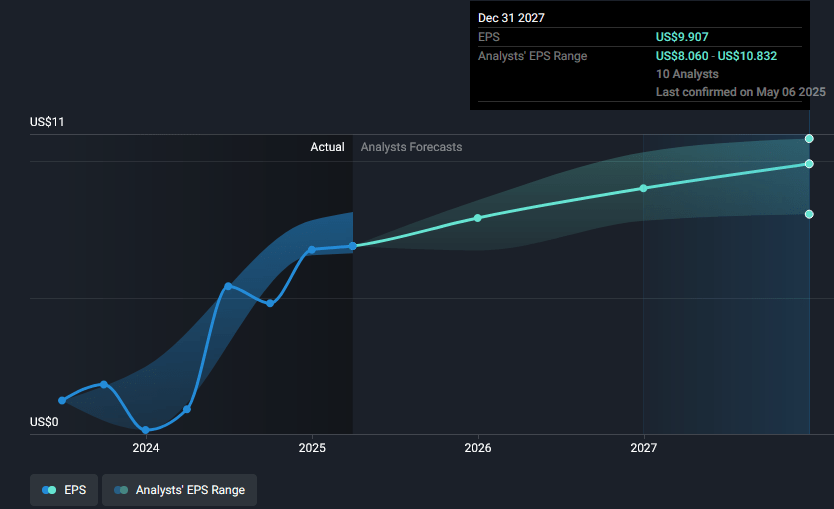
The chart above shows analysts’ earnings per share (EPS) forecasts up to 2027. We see that previous predictions have been relatively accurate, and in most cases, earnings have been within the analysts’ range. For our valuation purposes, we’ll take the lowest forecasted value for 2027, which is $8.06. We’ll also assume a slightly higher P/E for 2027 of 15. This figure is still below the industry average. Over the years, Merck has traded at higher levels than this.
Under these assumptions, the share price in 2027 should be around $120. At the time of writing, the share is trading at $81.16. This suggests a return of almost 48% over the three years. This return would be solely from capital gains, excluding dividends. Of course, these are just assumptions, not guaranteed results. Everyone should make their own assessment of the assumptions before taking any investment actions.
Dividends: A Steady Income Stream
A little earlier, I mentioned dividends. Let’s now look at the dividend performance.

The chart shows Merck’s dividend payments over the years. We see consistent growth in dividend payments. Analysts forecast this growth in payments to continue in the coming years (we have information up to 2027). According to the latest data, the dividend yield is around 4.3%. The payout ratio is 45%. In my opinion, these are good results. A quick check on Simply Wall St shows that the average dividend yield for the sector is 2.8%. We also see that the payout ratio isn’t too high, meaning that if the business continues as it has, the company should have no problem with future dividend payments.
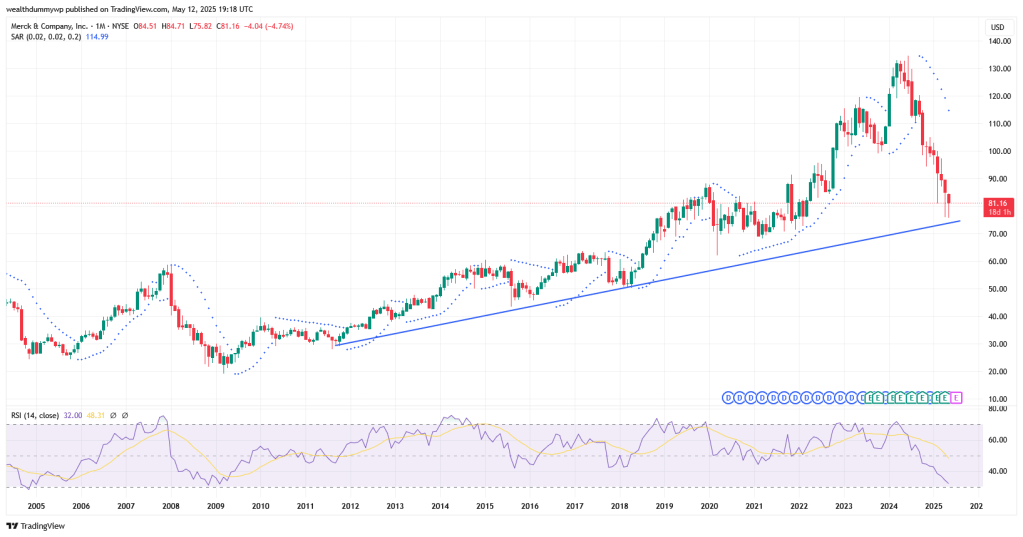
Technical Analysis: Charting the Course

My affiliate link. Sign up by using it and enjoy 15 USD bonus. Full details below.
Above is Merck’s price chart on a monthly basis. We see that the stock continues to be in a long-term uptrend. So far, this is confirmed by the price bouncing off support levels. The RSI is close to the oversold zone. The combination of these factors added to my confidence from the fundamental analysis, and I started buying shares. Of course, now that I have an open position, I will be following the chart’s development more closely. At the moment, it seems like I’ve found a good entry point.
Final Thoughts and My Position Plans: My Investment Strategy
In my previous post, I mentioned that I bought shares after selling some of my SoFi shares. If you haven’t read that post, I made the MRK purchase at $78.94 per share. On May 12, 2025, I sold the remainder of my SoFi shares (executed at $14.04) and part of my Pfizer holdings (executed at $21.77). With the proceeds from these two sales, I bought more Merck shares. The MRK purchase was at $74.80 per share.
The fact that I sold SoFi doesn’t mean I don’t like the business. It’s just that from a risk-appetite perspective, the position had served its purpose (my purchase price was below $10). Regarding Pfizer, it’s simply a matter of diversifying the risks in the pharmaceutical part of my portfolio.
But let’s get back to Merck after that little digression.
From what I’ve described above, it’s probably clear that I like the company and its business, and I believe in its future development. Obviously, after the initial purchase, I continue to buy. In my eyes, the current trading price of the company is fair. If I had to give a price at which I would stop buying, it would be $90. Above this price, the risk-reward profile would not meet my requirements. In my opinion, below this price is suitable for building a long-term position. Of course, this is my opinion, and it’s based on my assumptions and risk appetite. Every investor should make these assessments for themselves.
I hope my analysis of Merck has been helpful and enjoyable to read, and that it has motivated you to do your own evaluation of the company.
If you enjoy reading my posts and find them useful, please consider subscribing to my blog or follow me on social media. This way you`ll be notified as soon as I post something new. If you believe that someone may be interested in the topic, feel free to share the post with them.
Keywords: Merck, MRK, stock analysis, pharmaceutical stocks, investing, fundamental analysis, technical analysis, dividends, profitability ratios, valuation metrics, investment strategy, stock market, financial analysis, portfolio, investment, return on equity, return on assets, return on capital employed, P/E ratio, stock, finance.
Disclaimer:
I am not a financial or investment advisor. The content of this post represents my personal views and is purely informational. It should not be taken as financial or investing advice. Please do your own research and consult with a qualified financial advisor before making any investment decisions.
Disclaimer on the use of AI: Some of the information may be generated by using AI. Always double check the information and do your own research.
Details about TradingView affiliate link, according to the partner program:
- There is a $15 bonus for the referred user, which can be used for purchasing a TradingView paid plan
- In order to receive the bonus, you need to be a new user of TradingView
- If you sign up by using my affiliate link and purchase a paid plan through your web browser, I`ll be receiving an affiliate reward, which will help me support my blog


Leave a comment