
SoFi, a stock that is sitting on my watchlist since its IPO (Initial Public Offering). There were a lot of moments that I almost hit the buy button. But I didn’t. Until recently.
There is a lot of hype around the stock and I am usually avoiding entering such trades. However, in the beginning of April this year, the market started selling off heavily due to tariff worries. I saw this as an opportunity. I So did it. I bought a small position in the company.
I will be completely honest, I didn’t do any financial analysis before the purchase. The stock seemed oversold and I decided to go for it. Certainly, not a wise thing to do. So, in this post we’ll create SoFi`s financial analysis together. First, let’s have a proper introduction of the company.
SoFi, short for Social Finance, Inc., is a financial technology company based in the United States that provides a range of financial products and services. Founded in 2011, SoFi originally focused on student loan refinancing but has since expanded its offerings significantly. The company now includes personal loans, mortgage lending, investment management through SoFi Invest, and even cryptocurrency trading.
SoFi operates on a member-centric business model. It aims to leverage technology to provide low-cost financial solutions. The goal is to enhance the user experience. By cutting out traditional intermediaries, SoFi can offer competitive rates and a streamlined application process. The company emphasizes building a community for its users. It provides financial education resources and professional development tools. This fosters customer loyalty and positions SoFi as more than just a financial service provider.
Overall, SoFi’s innovative approach to personal finance, combined with its dedication to improving the financial well-being of its members, has made it a notable player in the fintech landscape.
We already know what SoFi is doing and what makes it special. Now, let’s go back to my position. On 4th of April I bought some SoFi shares at $9.67. At the time of writing the stock is trading at about $12.96. Currently, I am sitting at 34% unrealised gain. Please note that I made a post as soon as I bought it. It can be found here. As I already mentioned it’s a very small position in my overall portfolio. Together, we’ll see if it’s worth adding more to it or I should sell it. Let’s begin.
All the visuals that I am using in this post are provided by:

My affiliate link. Sign up by using it and enjoy 15 USD bonus. Full details below.
Revenue and Net Income
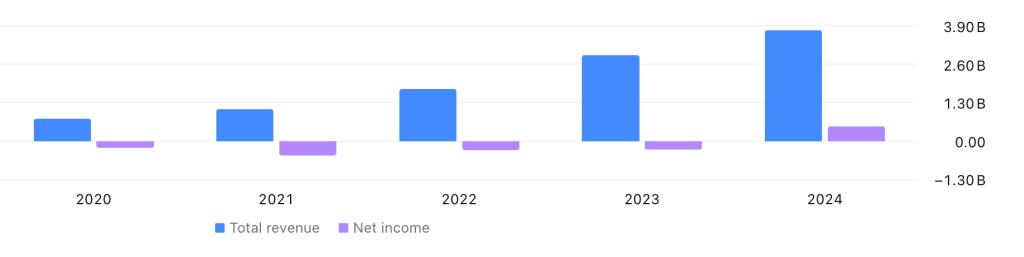
From the graph above we can see that SoFi became profitable in 2024. So it’s a company in its early days of profitability. The 2024 Net income came at slightly less than $500 million. The Revenue growth is amazing in my opinion. In 2020 the revenue was around $750 million. The reading for 2024 is $3.77 billion. The growth for this 5 year period is around 400%. So far so good.
Profitability Ratios
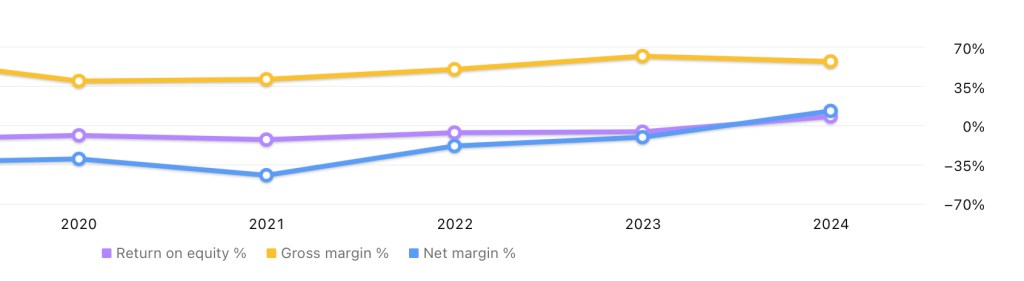
We won’t be discussing the Return on Equity (ROE) and the Net margin in details, since 2024 is the first profitable year in the observed period. I will just mention that the ROE for 2024 comes at 8.26% and the Net margin is 13.24%. Not a bad performance, but I can’t be sure if this is a one-off result or not. Despite that, we can see that there is a steady improvement over time. I will be watching for some more data on how these ratios are handled in the future. On the other hand, there is more historical data about the Gross margin. From the graph above we can see that it’s pretty stable with a slight upward trend. The 2024 reading is 57.64%. A very decent margin in my opinion. Certainly, it will be interesting for me to see the future developments.
Valuation Metrics

On the graph above are shown the Price to sales (P/S) and Price to book (P/B) ratios. I decided to skip the Price to earnings (P/E) ratio, since there isn’t much historical data. I will just mention that the current P/E is 32.22. Let’s compare the P/B and P/S data for the last three years. By looking at them we can see that the stock isn’t exactly cheap from a historical point of view. The cheapest period for the stock in terms of P/S and P/B was in 2022. Back then, at the end of the year SoFi was trading around $4.50. According to these valuation metrics it was a very good moment for a long entry. Comparing the stock price at the end of 2022 to the current one, pretty much confirms that. The current P/B ratio is sitting at 2.07, compared to 0.83 in 2022. The current P/S ratio is 3.76, compared to 2.36 in 2022. I am not including the data from 2021 in my analysis. It was a specific moment in the market and the valuations of this type of stocks were really high.
Future EPS Expectations
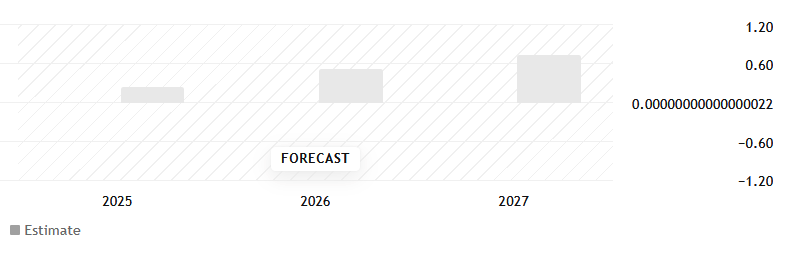
Let’s start by saying that the EPS (Earnings per Share) for 2024 was $0.39. From the graph above we can see that the analysts are expecting a steady uptrend in the company’s earnings. The forecast shows an expected EPS of $0.74 in 2027.
Here comes the fun part – trying to predict at what price SoFi would be trading in 2027. Please note that these will be just assumptions and nothing is guaranteed.
The first assumption that we’ll make is that the analysts are correct by predicting a $0.74 EPS in 2027. As far as I can see, SoFi managed to beat the forecasts in previous periods, so let’s consider this $0.74 as our base case. Now, we need to determine the P/E multiple. If we multiply the current P/E of 32.22 by an EPS of $0.74, this means that the stock should be trading at $23.84. In my opinion such P/E multiple will be justified if SoFi continues to grow at a similar rate. If so, the expected return if we buy today will be about 84% for the three year period. It definitely sounds good to me.
Now, let’s assume that the growth rate slows down. Having this in mind we need to choose a bit more reasonable P/E multiple. In my opinion something between 18 and 20 sounds like a decent number. I will be conservative, so I’ll choose 18. This means that the future price could be $13.32. This price tag tells a completely different story. If this happens there won’t be much gains for the period (current price $12.96).
Usually, I am trying to look for an average number. So, the average between the best case of $23.84 and the base case of $13.32 is $18.58. If we decide to choose this scenario some decent gains are possible. About 43% upside from the current price for the three year period. It’s not something stellar, but still a decent profit.
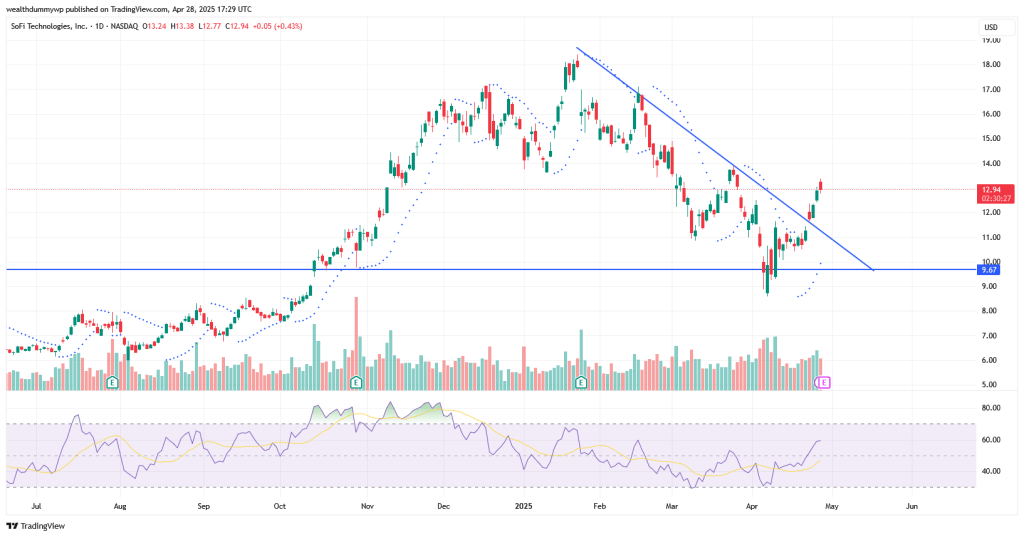
Technical Analysis
My affiliate link. Sign up by using it and enjoy 15 USD bonus. Full details below.
From the daily chart above we can see that the stock is trading above its recent downtrend line. By the blue line I’ve marked my buying price. The $13 price tag seems as a crucial one for me. I believe that if the stock manages to conquer this level we can see some upside movement. If not, a test of the $11.50 support is possible. The chart I’m seeing doesn’t give me much clarity on where the price is heading. The RSI continues its climbing. The current reading of the indicator shows a level of 60. Just a reminder – a level of 70 for the RSI might be considered as an overbought market. Tomorrow, SoFi reports earnings (I’m writing this post on 28th of April), so it’s possible to see some price volatility. If the company delivers better than expected results, it can benefit the momentum. We can see a nice upside movement. The time will tell.
My Game Plan
As I’ve already mentioned my buying price is $9.67. Having in mind this entry level I fell comfortable holding the position. For sure, I won’t be adding more to it at these price levels. If the stock keeps its momentum and goes higher to $14.50 and above I am thinking of selling at least half of the shares that I own. Maybe the company is worth more than that but based on my analysis I’d prefer closing some profits. In my opinion, it’s better to have about 50% return secured in my pocket, than a 100% return in my dreams. However, if the stock goes back down to my buying price or lower, I will consider buying more of it. At these levels I fell comfortable with the risk-reward profile of the investment. Certainly, SoFi is an interesting company that deserves to be followed closely.
If you enjoy reading my posts and find them useful, please consider subscribing to my blog or follow me on social media. This way you`ll be notified as soon as I post something new. If you believe that someone may be interested in the topic, feel free to share the post with them.
Keywords: SoFi Technologies stock analysis, SOFI profitability 2025, fintech investment review, SoFi revenue growth, valuation metrics, P/E ratio, P/B ratio, investment potential
Disclaimer:
I am not a financial or investment advisor. The content of this post represents my personal views and is purely informational. It should not be taken as financial or investing advice. Please do your own research and consult with a qualified financial advisor before making any investment decisions.
Data sources: for the fundamentals data (stock statistics, EPS, etc.) and the chart I have used tradingview.com. The numbers I have posted are taken from the mentioned source at the time of writing.
Some of the information may be generated by using AI. Always double check the information and do your own research.
Details about TradingView affiliate link, according to the partner program:
- There is a $15 bonus for the referred user, which can be used for purchasing a TradingView paid plan
- In order to receive the bonus, you need to be a new user of TradingView
- If you sign up by using my affiliate link and purchase a paid plan through your web browser, I`ll be receiving an affiliate reward, which will help me support my blog


Leave a comment