
Qualcomm, ticker QCOM is one of my favorite stocks that I own. I know that it’s bad to have emotional attachments to a stock, but it is what it is. The reason why I like the stock so much is that it performed very well for me in the past. I have been holding it for a while now. During this time I have been buying it, selling it and then buying it again. In this post, I will share with you my Qualcomm stock analysis. I will also discuss the developments in my personal holdings. Finally, I’ll provide my opinion about the company’s future. So, stay till the end. Let’s start with a brief presentation of Qualcomm.
Qualcomm, ticker symbol QCOM, is a global leader in wireless technology and semiconductors. It is primarily known for its role in the development of mobile communications standards like 3G, 4G, and 5G. The company’s business model focuses on designing and manufacturing advanced semiconductor products. These include system-on-chips (SoCs) used in smartphones, tablets, and other connected devices. Qualcomm generates revenue through a combination of product sales and licensing agreements, where it charges fees for the use of its patented technologies. Additionally, Qualcomm invests in research and development. This is done to innovate and maintain its competitive edge in the ever-evolving tech industry. This makes it a pivotal player in the Internet of Things (IoT) and automotive sectors.
From the description above we can see that the company operates in the Semiconductor Industry. As you might know from my previous posts I love the technology sector. I also love technology stocks that in my opinion are a value investment opportunity. Now, let me tell you about all the buying and selling that I mentioned in the beginning.
I started building my position in 2023. The first purchase was made on 5th of May 2023. By the end of the year my position was built and the average price was $112.13. I was able to buy in, at a decent price during the market sell off due to the inflation worries. Then I held. In 2024 the market became too optimistic in my opinion. That is why I started selling some of my shares. In two separate transactions I sold almost 50% of my position. The average selling price was $171.15. Obviously, this wasn’t the top, but I underestimated the fact that the market can get a lot more optimistic. Anyway, I was happy with my profit. The return for this one year period was 52.64%. A decent performance in my opinion. Then April 2025 came. The market started selling off, due to tariff worries. Qualcomm`s stock was significantly down from its peak. I saw an opportunity and on 7th of April I bought back some of the previously sold shares. My buying price was $122.70. I made a blog post about this purchase on the same day. It can be found here. Subscribe to my blog or follow me on social media so you don’t miss any of my updates. Anyway, my average acquiring price of the whole position is $117.18. At the time of writing QCOM is trading around $147.
All the visuals that I have used in this post are provided by:

My affiliate link. Sign up by using it and enjoy 15 USD bonus. Full details below.
We’ve already discussed my story with the stock. Now, let’s see how the company is currently performing. We’ll start with:
Revenue & Net Income
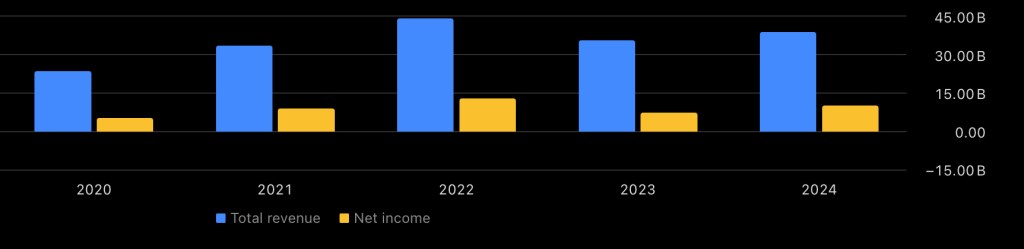
The graph above shows the Total revenue and the Net income starting from 2020 until 2024. There are ups and downs over the years, but the overall trend seems to be going up. The Revenue in 2024 was $38.96 billion and for the 2020 it was $23.53 billion. This means that the company managed to increase its revenue by 65% during this period. The 2024 Net income is $10.14 billion and $5.20 billion in 2020. The Net income increased by 95% over this 5 year period. Will this performance continue in the future? I certainly don’t know. The time will tell. The past performance is already in the books, so I am using it as a starting point. A bit later we’ll discuss the analysts’ expectations.
Valuation Metrics
We have discussed in general the past performance of the business. Now, I would like to focus our attention on the valuation.
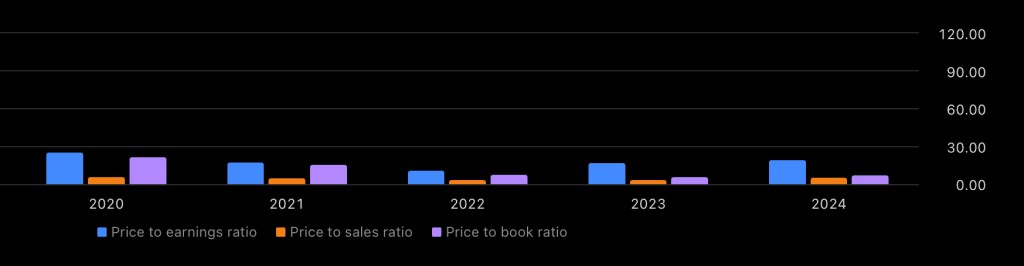
From the graph we can see that the valuations aren’t extremely low in terms of historical performance. The P/E (Price to Earnings) in 2024 was 18.96 and the current P/E is 14.83. In 2022 the stock was trading at a P/E of 10.65. Of course, over the years there were also some higher readings of this metric. In 2020 the P/E was around 25.31. In my opinion the current reading of 14.83 can suggest a good value opportunity. Especially, having in mind the average P/E ratio for the Semiconductor Industry.
Profitability
Let’s check how the company is performing in terms of profitability.

Both, the Gross margin and the Net margin are pretty stable over the years. This is something that I like to see. In 2024 the Gross margin was 56.21% and the Net margin was 25.95%. In my opinion these are good readings. We can see from the graph that there is a decrease in the Return on Equity (ROE). In 2024 the ROE was 42.25%. Despite the decrease in this metric over the years I am happy with the latest number.
Financial Position
I would like to discuss with you one more thing that I find really important when analyzing a company. It’s financial position. Let’s see how Qualcomm is performing:
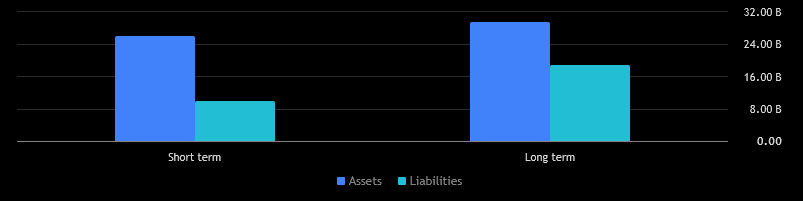
The graph above represents QCOM’s MRQ (Most Recent Quarter) financial position. We can see that the liabilities are well covered from the assets. In the short term Qualcomm has $9.95 billion in current liabilities. The current assets are $26.07 billion, of which $8.71 billion are cash and cash equivalents. In the long term – the non-current assets are $29.51 billion. The non-current liabilities are $18.74 billion. I believe that it’s a good moment to mention that the non-current assets include almost $11 billion in Goodwill (an intangible asset). I believe that this needs to be taken into consideration. Despite that, my opinion is that the company has a good overall financial position.
Future EPS Expectations
I believe that it’s time to try and take a look into the future:

The graph above displays analysts’ expectations for the Earnings per Share (EPS), indicating a stable performance with a limited growth. They forecast an EPS of $11.78 in 2028. Assuming they are correct, I will calculate the theoretical price of QCOM in 2028. I will do that by using the average P/E ratio from the last five years. The average P/E of Qualcomm for this period is 17.74. I believe that this is a reasonable number having in mind the industry in which the company operates. Let’s do the math:
$11.78 (EPS) x 17.74 (P/E Ratio) = $208.97 (Theoretical price). I believe that it is good to include some margin of error. In this case I will decrease the theoretical price with a 15%. This will result in $177.62 theoretical price with the 15% margin of error included. What this means in terms of returns? I will use the current price of $147 and the $177.62, which we already calculated. This will result in about 20% return for the whole period. Of course, the return will be higher if we add the dividends, but still the result won`t be something stellar. Now, let`s see what would be the theoretical return using my acquiring price. As I mentioned in the beginning my average buying price is $117.18. If I compare it to the calculated $177.62, this means that my potential returns are about 50% for the whole period. I think it’s a good moment to mention that all of the written above is just assumptions. The results are not guaranteed. No one can predict the future and I am certainly not trying to. Always do your own due diligence.
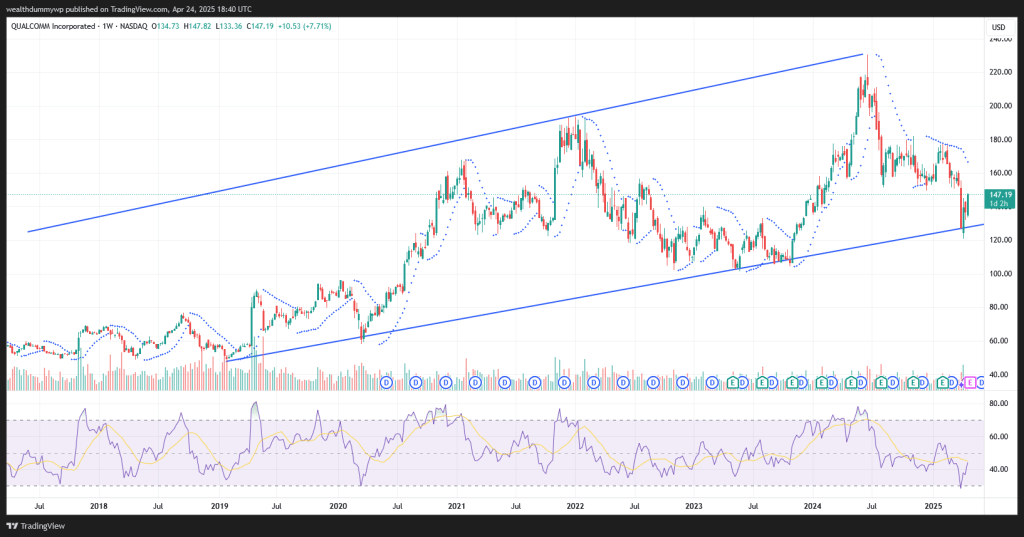
Technical Analysis
Let`s visit the QCOM stock price chart:
My affiliate link. Sign up by using it and enjoy 15 USD bonus. Full details below.
I believe that the chart is pretty much self-explanatory. We can see that the stock is trading in a uptrend channel. My last purchase was around the level where the price touched the lower part of the channel. The RSI is going up from the oversold levels. I am still waiting for a confirmation from the weekly Parabolic SAR that the up trend will continue. Overall the trend observed on the price chart is looking good to me.
My plans for the stock
As of now I am thinking of holding the stock. As we have already discussed my average buying price is significantly lower than the current one. I won`t be adding more to my position at these price levels. If the stock price comes down, closer to my average price, I will consider adding more. Anything below $125 will be suitable for my own risk-reward profile. Of course, if the stock price goes a lot higher to levels that I consider unreasonable, I will be selling some of my shares. Currently, I will be holding and enjoying the dividend yield. I certainly believe that the QCOM stock deserves to be closely followed.
If you enjoy reading my posts and find them useful, please consider subscribing to my blog or follow me on social media. This way you`ll be notified as soon as I post something new. If you believe that someone may be interested in the topic, feel free to share the post with them.
Keywords: Qualcomm stock analysis, QCOM investment 2025, semiconductor industry insights, AI-driven growth, valuation metrics, revenue trends, market outlook
Disclaimer:
I am not a financial or investment advisor. The content of this post represents my personal views and is purely informational. It should not be taken as financial or investing advice. Please do your own research and consult with a qualified financial advisor before making any investment decisions.
Data sources: for the fundamentals data (stock statistics, EPS, etc.) and the chart I have used tradingview.com. The numbers I have posted are taken from the mentioned source at the time of writing.
Some of the information may be generated by using AI. Always double check the information and do your own research.
Details about TradingView affiliate link, according to the partner program:
- There is a $15 bonus for the referred user, which can be used for purchasing a TradingView paid plan
- In order to receive the bonus, you need to be a new user of TradingView
- If you sign up by using my affiliate link and purchase a paid plan through your web browser, I`ll be receiving an affiliate reward, which will help me support my blog


Leave a comment